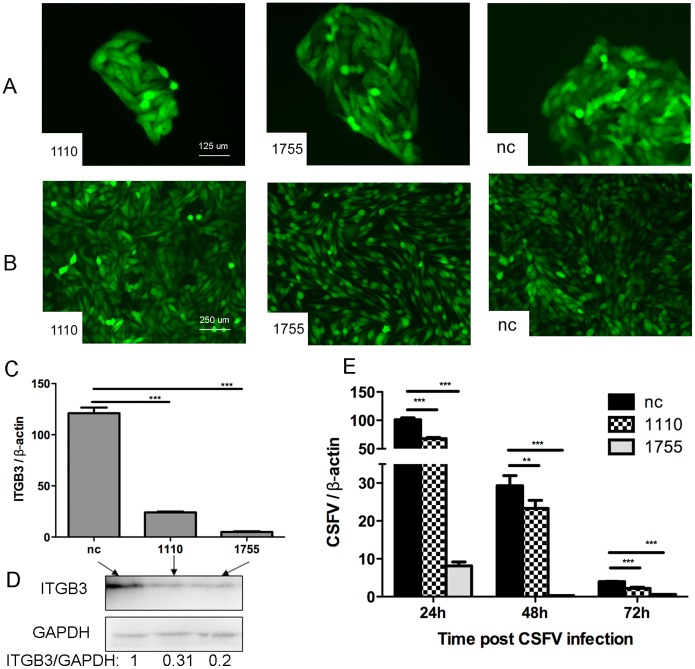
Figure 7. Evaluation of integrin β3 deficiency and CSFV proliferation in integrin β3 constantly defected cells (ICDC).
A) Fluorescence pictures of ICDC colonies. 1110, 1755 and nc respectively denote the ICDC with shRNA1110, shRNA1755 or nc construct constantly expressed. B) Fluorescence pictures of mass cultures of ICDC used for CSFV infection. C) Assessment of integrin β3 deficiency in ICDC by two-step qPCR using β-actin as the norm. D) Western blot results showing the integrin β3 deficiency in protein level. Ratio of the signal intensity was calculated through NIH ImageJ. E) Evaluation of CSFV proliferation rate in ICDC at 24 h, 48 h or 72 h p.i., respectively. “nc” denotes CSFV proliferation rate in ICDC constantly expressing nc construct. (***p<0.001 denotes extremely significant difference, **p<0.01 denotes very significant difference).

