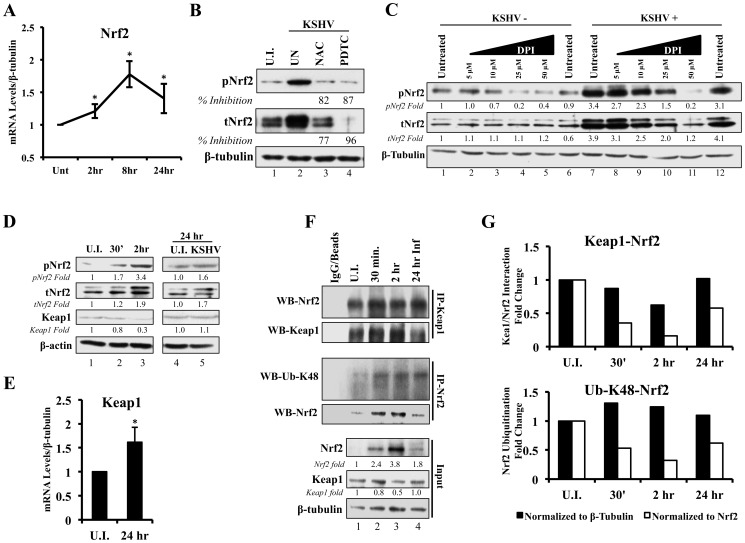
Figure 4. Effect of KSHV ROS induction on Nrf2-Keap1 interaction and Nrf2 ubiquitination.
A) Real-time RT-PCR analysis of Nrf2 mRNA measured at various times post-infection of HMVEC-d cells. β-tubulin was used as an endogenous house-keeping gene. Each point represents fold induction compared to uninfected cells (Unt; arbitrarily set to 1) ± SD for 4 independent experiments. * = p<0.05. B) Starved HMVEC-d cells were treated with NAC (10 mM) or PDTC (100 µM) for 2 hr prior to infection with KSHV (20 DNA copies/cell) for an additional 2 hr before immunoblot analysis for tNrf2 and pNrf2. NAC = N-Acetylcysteine; PDTC = pyrrolidine dithiocarbamate. C) Starved HMVEC-d cells were treated with increasing concentration of DPI (0–50 µM) for 2 hr prior to infection with KSHV (20 DNA copies/cell) for an additional 2 hr before immunoblot analysis. DPI – Diphenyleneiodonium. D) Infected HMVEC-d cells were immunoblotted for pNrf2, tNrf2 and Keap1. Fold inductions normalized to β-actin and relative to the uninfected (U.I.) condition (arbitrarily set to 1) are indicated. E) Real-time RT-PCR analysis of Keap1 mRNA measured 24 hr p.i. from HMVEC-d cells infected with KSHV (20 DNA copies/cell). β-tubulin was used as endogenous house-keeping control. Bars represent fold change ± SD for 3 independent experiments. * = p<0.05. F) HMVEC-d cells were infected for the indicated time points and lysed with NETM buffer to isolate whole cell protein. Equal amounts of protein (200 µg/condition) were immunoprecipitated using anti-Keap1 or anti-Nrf2 antibody O/N at 4°C and immunoblotted for tNrf2 and Keap1 or Lysine-48-linked Ubiquitin (Ub-K48) and tNrf2, respectively. Bottom three panels indicate the whole cell lysate levels of Nrf2, Keap1 and β-tubulin. G) The pull-down results were normalized to either whole cell lysate (input) β-tubulin (black bars) or Nrf2 (white bars), and fold inductions relative to the uninfected conditions (U.I. - arbitrarily set to 1) are indicated. The Keap1-Nrf2 interaction is shown in the top graph, and the Nrf2 ubiquitination levels are shown in the bottom graph.

