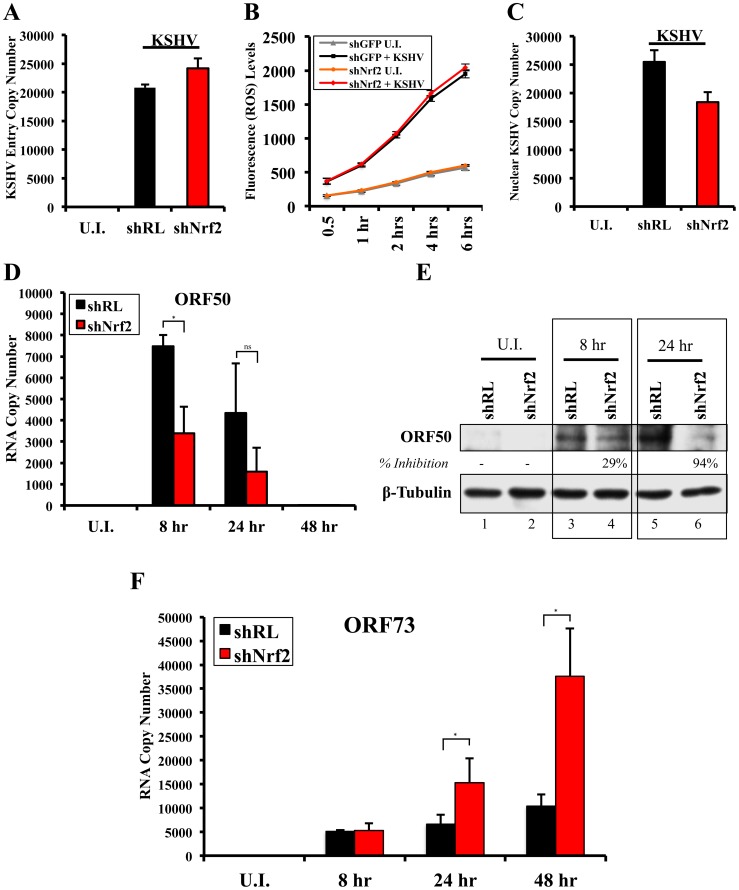
Figure 12. Effect of Nrf2 modulation on KSHV biology.
A) KSHV entry assay was performed on cells transduced with shRL or shNrf2 and infected with KSHV (20 DNA copies/cell). DNA real-time PCR was performed with ORF73 gene-specific primers, and the absolute KSHV copy number was calculated from a standard curve obtained by real-time PCR of standards with known concentration of ORF73. B) Starved HMVEC-d cells in a 48-well plate previously transduced with lentivirus vectors expressing either shGFP or shNrf2 were labeled with the ROS-measuring dye, CM-H2DCFDA, and then infected with KSHV (40 DNA copies/cell) for the indicated time points prior to fluorescence measurement. Values indicate the mean ± SD for 3 independent replicates. C) KSHV nuclear delivery assay was performed on cells that were transduced with shRL or shNrf2 prior to infection with KSHV for 2 hr. Real-time PCR was performed using ORF73 gene-specific primers on DNA extracted from the nuclei of infected cells to determine the levels of viral DNA. The absolute copy number was calculated from a standard curve obtained by real-time PCR of standards with known concentrations of ORF73. Bars indicate mean ± SD for 3 independent replicates. D and E) Starved HMVEC-d cells transduced with either shRL or shNrf2 were infected for various times with KSHV (50 DNA copies/cell) and analyzed by one-step real-time PCR reaction and by WB using ORF50-specific primers and antibody, respectively. F) ORF73 (LANA-1) gene-specific primers were used to determine the expression levels of ORF73 from RNA as in panel 12D. The absolute copy number was calculated from a standard curve obtained by real-time PCR of RNA standards of ORF73 or ORF50 with known concentrations. Bars indicate mean copy number ± SD of 3 independent replicates. * = p<0.05, ns = p>0.05.

