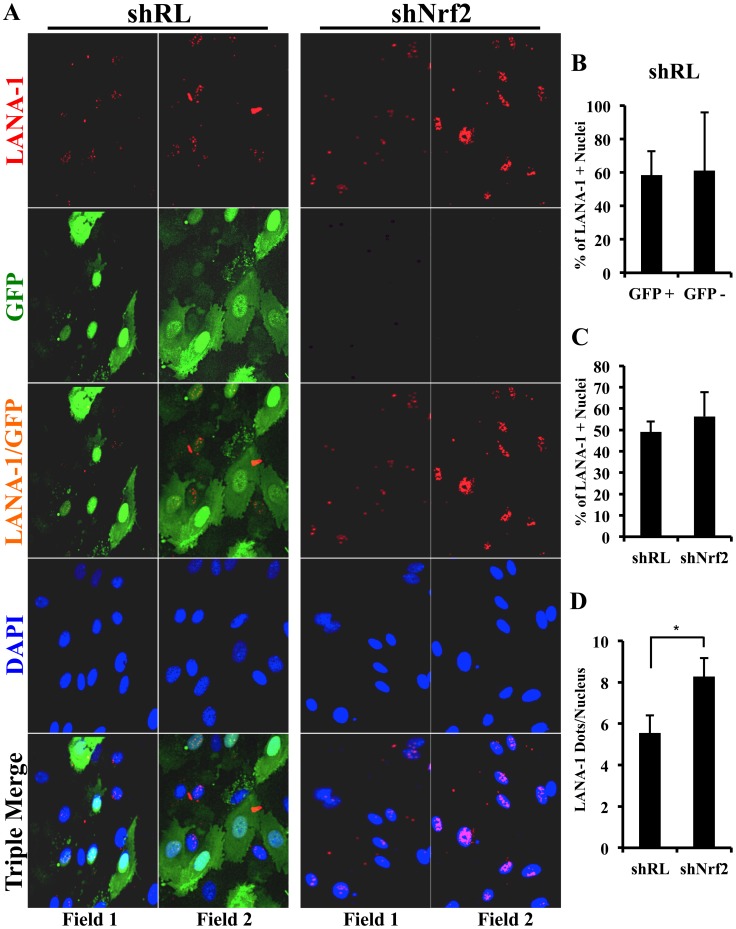
Figure 13. LANA-1 puncta during infection of Nrf2-deficient cells.
shRL- and shNrf2-transduced HMVEC-d cells were infected with KSHV (40 DNA copies/cell) for 24 hr prior to IFA analysis using a rabbit LANA-1 specific antibody (red). The vector containing shRL expresses the green fluorescent protein (GFP), which explains the green color of shRL cells that have been successfully transduced with the vector. B) Quantification of the number of KSHV+ (LANA-1+) cells in the shRL-transduced cells that expressed GFP (successfully transduced) and cells that did not (unsuccessfully transduced). Bars represent mean ± SD for three individual fields containing at least 10 cells each (panel A, row 3, columns 1–2). C) Quantification of the number of KSHV+ (LANA-1+) cells in shRL vs. shNrf2 conditions. Bars represent mean ± SD for three individual fields containing at least 10 cells each (panel A, row 4). D) Quantification of the number of LANA-1 dots/nucleus in shRL vs. shNrf2 conditions. Bars represent mean ± SD for three individual fields containing at least 10 cells each (panel A, row 4).

