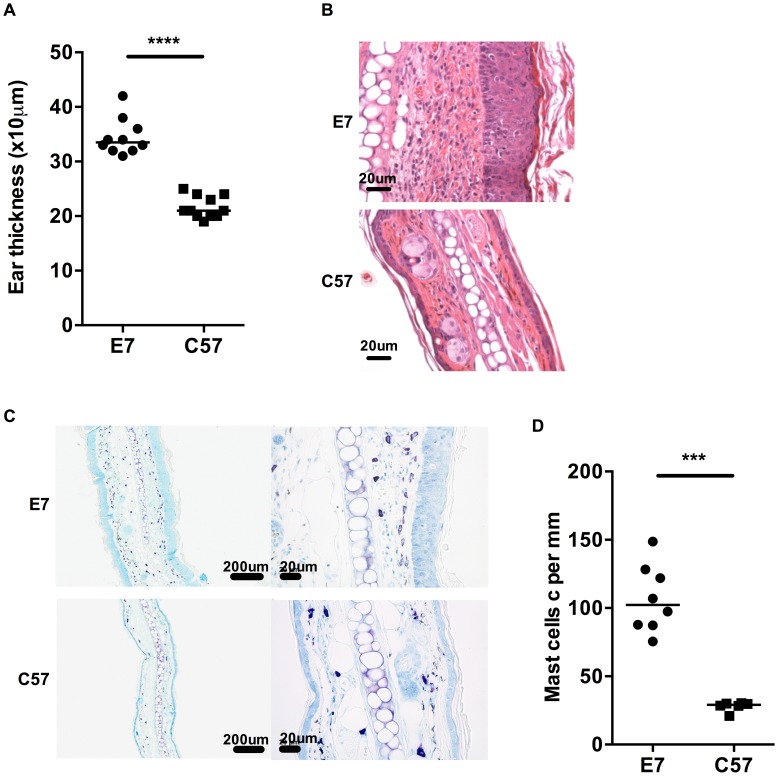
Figure 1. MCs are highly represented in E7 skin.
A) Ear thicknesses were measured in naive age-matched E7 and C57 mice using a micrometer gauge (n = 10 and 11, respectively, ****p<0.0001). B) Representative images of E7 and C57 ear skin analyzed by H&E stain (scale bar = 20 µm). C) Representative images of E7 and C57 ear skin analyzed by toluidine blue stain, which is specific for MCs (purple, scale bar = 100 µm (left) and 20 µm (right)). D) MC numbers expressed per mm cartilage length (n = 8 E7 mice and n = 6 C57 mice, respectively; ***p<0.001).

