Figure 1.

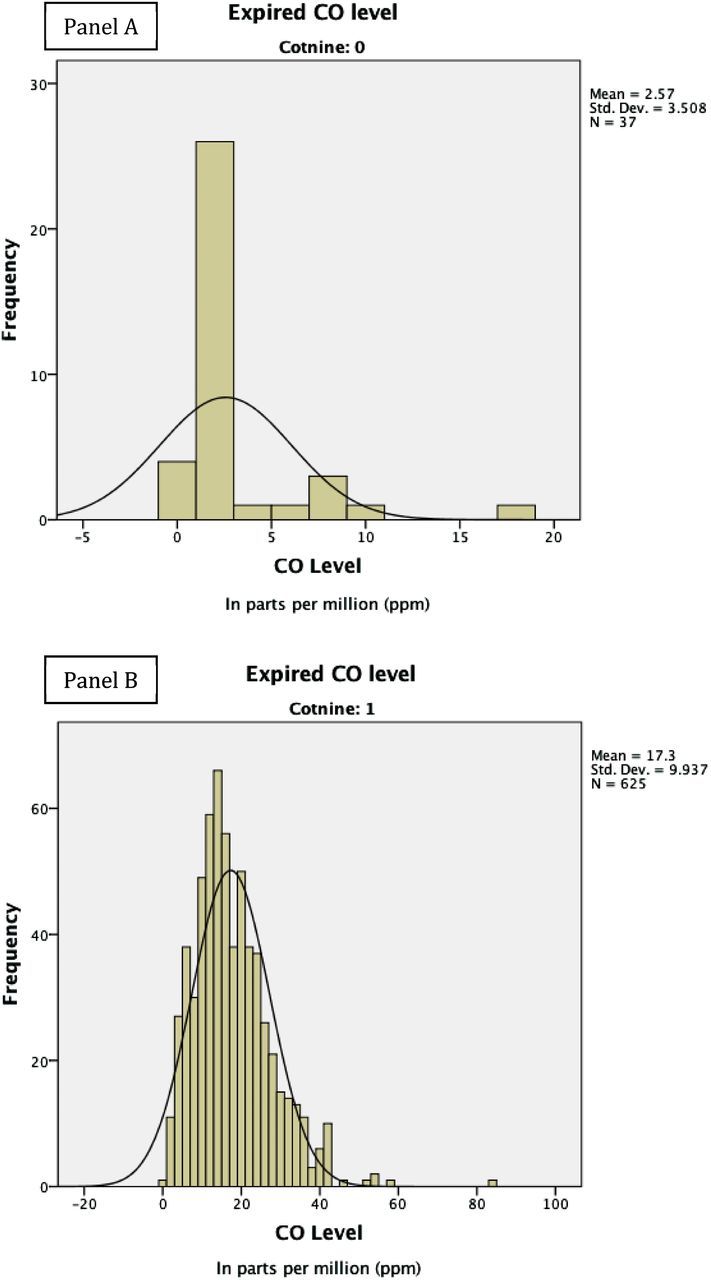
Histograms for carbon monoxide (CO) distribution of cotinine negative (Panel A) and positive (Panel B) smokers (N = 662).

Histograms for carbon monoxide (CO) distribution of cotinine negative (Panel A) and positive (Panel B) smokers (N = 662).