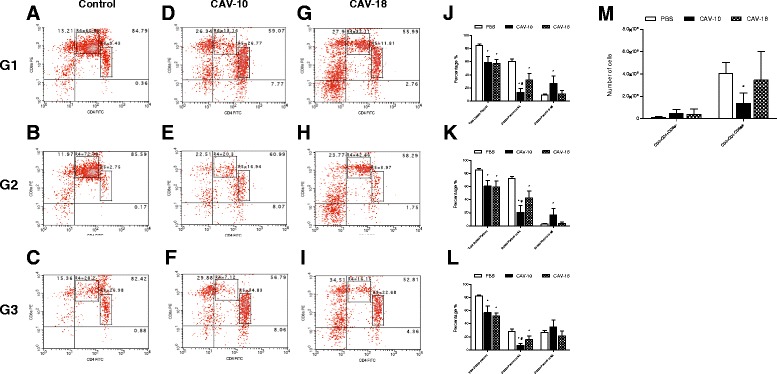
Figure 6.

Analysis of different lymphocyte subpopulations in the thymus of SPF chickens. Animals were studied 14 days after infection with CAV or inoculation with PBS at 2 weeks of age. (A-I) CD4 + CD8α-, CD4-CD8α + and CD4 + CD8α + (DP) thymocytes from one thymus from each group in G1 (A,
D,
G), G2 (B,
E,
H) and G3 (C,
F,
I). R4 and R5 represent DP thymocytes with different CD4 and CD8α surface expression. (J-L) Mean percentage of total DP, DP in R4 and DP in R5 thymocytes in G1, G2 and G3 from control (□), CAV-10 (■) and CAV-18 ( ) birds. (M) Mean absolute number of CD4 + CD8α- and CD4-CD8α + thymocytes in G1 from control (□), CAV-10 (■) and CAV-18 (
 ) birds. Cells were triple-labeled with anti-CD3, anti-CD4 and anti-CD8α antibodies conjugated to SPRD, FITC and PE, respectively, and analyzed by flow cytometry. The results are expressed as the mean (SD) from each group, n = 6. *p < 0.05 vs. Control; # p < 0.05 vs. CAV-18.
