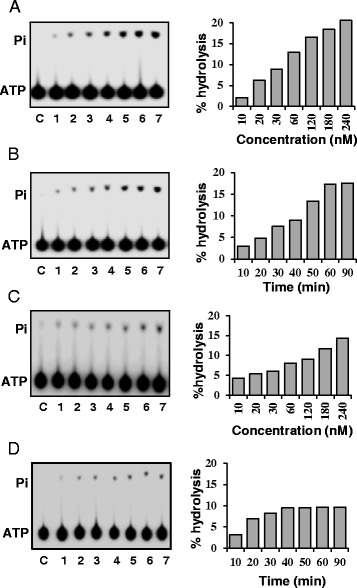
Figure 1.

ATPase activity of purified OsSUV3 in presence of DNA and RNA. (A) ATPase activity of purified OsSUV3in the presence of ssDNA. Lanes 1–7, reactions with different concentration (10–240 nM) of enzyme. (B) Time dependence of ATPase activity of OsSUV3 (180 nM) in the presence of ssDNA. Lanes 1–7, reactions with enzyme at various time points. (C) ATPase activity of purified OsSUV3 in presence of RNA. Lanes 1–7, reactions with different concentration (10–240 nM) of enzyme. (D) Time dependence of ATPase activity of OsSUV3 (180 nM) in presence of RNA. Lanes 1–7, reactions with enzyme at various time points. Lane C in A-D shows reaction without enzyme. The quantitative data of the autoradiograms in A-D gels are shown as histograms on the right side of each autoradiogram.
