Figure 3.

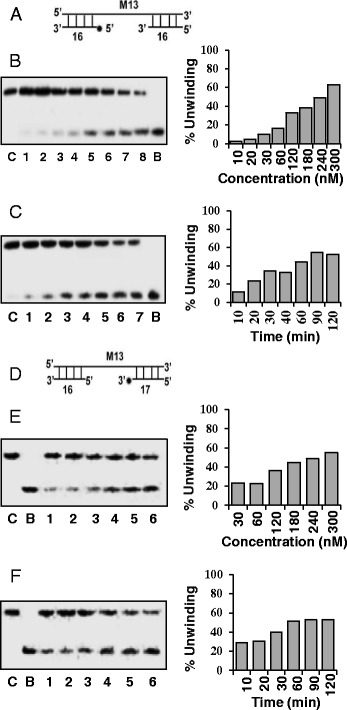
Direction of DNA unwinding by OsSUV3 protein. (A) The structure of the linear substrate for the measurement of 3’ to 5’ direction activity is shown. An asterisk (*) denotes the 32P-labeled end. The 3’ to 5’ direction specific DNA helicase activity of OsSUV3 protein using this substrate is shown in panels B and C. (B) Lanes 1–8 are reactions with increasing concentration (10–300 nM) of OsSUV3 protein. (C) Time-dependence of the helicase reaction with substrate shown. Lanes 1–7 are reactions with 250 nM of OsSUV3 at various time points. (D) The structures of the linear substrate for the 5’ to 3’ direction is shown. An asterisk (*) denotes the 32P-labeled end. The 5’ to 3’ direction specific DNA helicase activity of OsSUV3 protein using this substrate is shown in panels E and F. (E) Lanes 1–7 are reactions with increasing concentration (30–300 nM) of OsSUV3 protein. (F) Time-dependence of the helicase reaction with substrate shown. Lanes 1–6 are reactions with 250 nM of OsSUV3 at various time points written on top of the autoradiogram. The quantitative enzyme activity data from the autoradiogram in B-C and E-F are shown as histograms on the right side. In panels B, C, E and F, lane C is the reaction without enzyme and lane B is the heat-denatured substrate.
