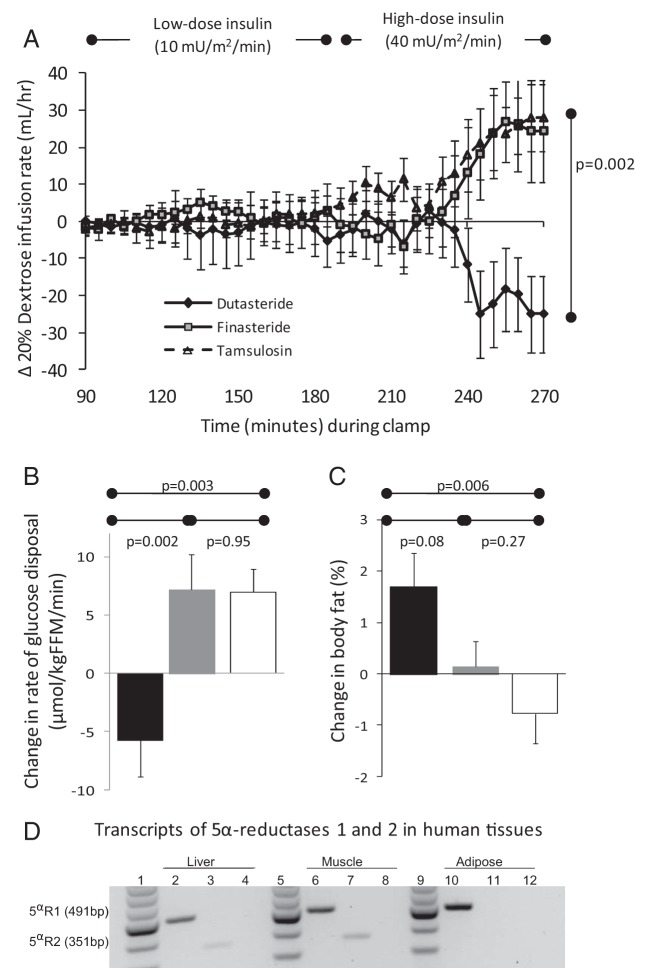
Figure 2.
Effects of 5αR inhibition on insulin sensitivity and body fat. A, Change in glucose (20% dextrose) infusion rate (milliliters per hour) required to maintain euglycemia during low-dose (10 mU/m2/min) and high-dose (40 mU/m2/min) insulin infusion. Data are mean (SEM). B, Change in glucose Rd during high-dose insulin infusion after dutasteride (black), finasteride (gray), or tamsulosin (white) treatment. Data are mean (SEM). C, Change in percent body fat measured by electrical bioimpedance after dutasteride (black), finasteride (gray), or tamsulosin (white) treatment. Data are mean (SEM). D, Transcripts of 5αR1 and -2 in human liver, skeletal muscle, and sc adipose tissue. Lanes 1, 5, and 9, 100-bp ladder; lanes 2, 6, and 10, 5αR1; lanes 3, 7, and 11, 5αR2; lanes 4, 8, and 12, negative control. Abbreviation: FFM, fat-free mass.

