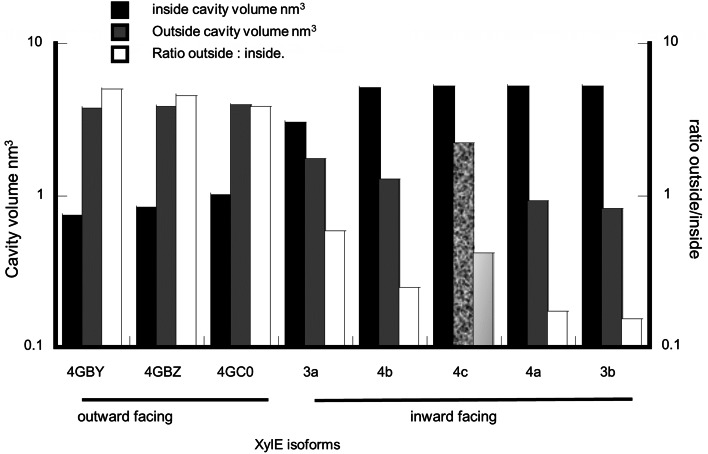
Fig. 3.
Histogram showing the size of the inside tunnels nm3 plotted in order of increasing inside cavity volume. The volume of the corresponding external tunnels and the ratio of external: internal are also plotted. There is a general decrease in the ratio of external: internal volume as the internal volume increases: however, exceptionally the external vestibular tunnel volume is larger than would be predicted if there was a rigidly controlled inverse relationship between internal and external vestibules

