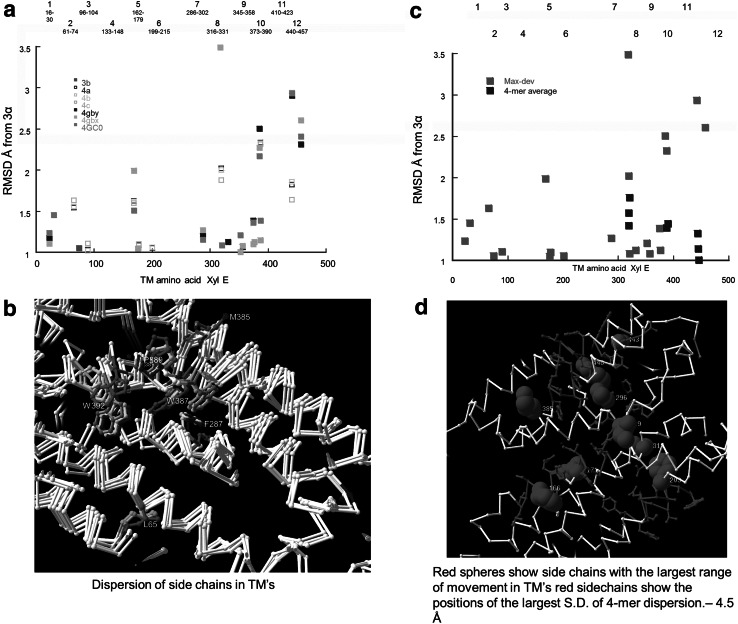
Fig. 6.
a Map showing large RMSD deviations of C-α positions in TM’s of XylE conformers. The map of the main C-a deviations shows that the major deviations occur in TMS 7–12. The main changes occurring in TMs 10–12 in conformers 4a, 4c, 4Gbx 4Gby and 4GC0 in TM 10 and the outside-facing holo-conformers 4Gbx 4Gby and 4GC0 in TM12. b Superimposed XylE conformers showing side chain divergences. See also Table 2 for the changes. The large changes in P389 and W392 suggest a possible gating structure. Additionally, the large changes in F287 and W387 indicate a second gating position. c Map showing maximal deviations of C-a positions from those in J3a. Red shows the C-α maximal deviations of individual amino acids. Blue squares show the 4-mer average deviations. Maximal deviations occur in TMs 7 9 and 11. d Positional changes in XylE 3-D structure showing 4-mer regions of maximal deviation within the C-a within the TMs. The red spheres show the largest SD of side chain deviations within the TM regions. Note almost the entire central channel shows large divergences between conformers and there are regions at either end with large side chain SD (Color figure online)

