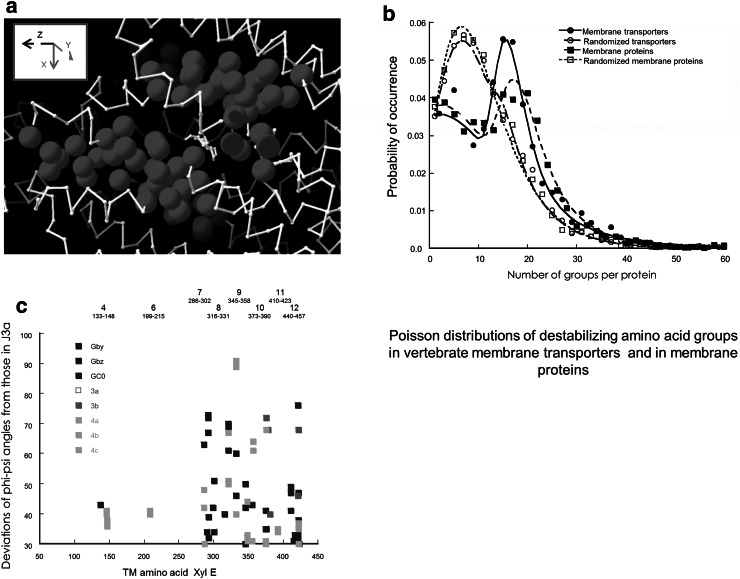
Fig. 7.
a The sequences close to the central high affinity binding site containing a high density of destabilizing amino acids; namely G, A, P, C, S, I and V. The closest proximity of the highest densities of these groups was estimated and plotted as running averaged of ten amino acids, along the entire sequence. This was added to a scaled B-Factor and the data mapped onto a 3D XylE crystal structure. b Graphs showing double Poisson distribution fits to the probability of the occurrence of destabilizing groups within transmembrane proteins. The graphs show the probability of occurrence of destabilizing groups in 7231 vertebrate transmembrane transporters (filled circles) 109486 groups and 174257 vertebrate transmembrane proteins that are not transporters (filled squares) 174257 groups, randomised transporters open circles, and randomised proteins (open squares). The lines show the occurrence probability distributions of the numbers of these destabilizing groups. These are fitted, using a Marquardt–Levenberg algorithm to the double Poisson distribution: S.λ 1.exp{−λ 1.(X−μ1)−exp(−λ 1. (X−μ1)} + (1−S).λ 2.exp{−λ 2.(X−μ2)−exp(−λ 2.(X−μ2)}. Where λ 1,2 are the variances in the two subpopulations, μ1,2; the mean values X are the numbers of the sub-population groups per protein and S is a scaling factor. S adjusts the relative contribution of the two subpopulations to the overall occurrence probability. It is evident that randomization of the amino acid sequences reduces the modal frequency of occurrence of destabilizing groups in both transmembrane transporter proteins from 16.04 ± 0.31 to 7.08 ± 0.25 (P < 0.001). A similar reduction occurs with transmembrane proteins that are not assigned within the database as transporters. On randomising the protein sequence, there is a significant reduction in the scaling factor S from 0.46 ± 0.07 to 0.00 ± 0.03 (P < 0.001). This indicates that there is a non-random element to the occurrence of destabilizing sequences within transmembrane proteins whether transporters or not. c Map showing the positions of major deviations in combined Φ−Ψ angles of XylE conformers in TMs in comparison to inside-facing holo-conformer J3a. The outside-facing holo-conformers Gby, Gbz and 4GC0 are all shown as navy blue squares; the deviation of inside-facing holo-conformer from 3b is shown in red and the apo inside-facing conformers are shown as green squares. It can be seen that the major changes are mainly in TMs 7–12. The holo-apo transformations occur mainly in Tm- 7–10 whereas inside to outside-facing transformation of the holo-forms mainly represents increases in TMs 7–9 and 12. Note that large deviations occur between the two inward-facing holo-forms in TMs 10 and 12 (Color figure online)

