
Figure 2.
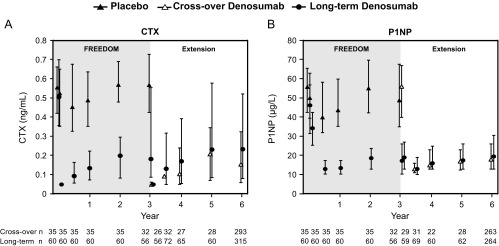
Concentrations of the bone turnover markers serum CTX (A) and serum P1NP (B). Data are medians and interquartile ranges. Time points include the following: baseline, month 1, and years 0.5, 1, 2, 3, 3 (day 10), 3.5, 4, 5, and 6. n, number of subjects with observed data.