
Figure 4.
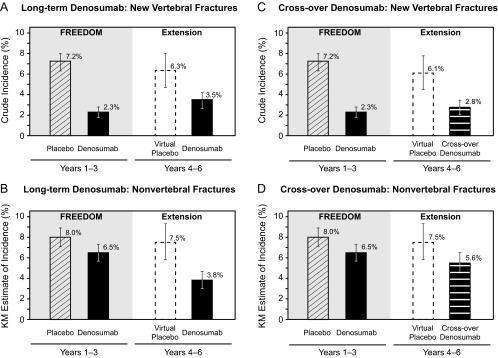
Incidence of new vertebral fractures (A and C) and nonvertebral fractures (B and D). Solid bars represent actual data collected and dashed bars represent virtual placebo data. Percentages for new vertebral fractures are crude incidence and percentages for nonvertebral fractures are Kaplan-Meier estimates. Error bars correspond to 95% confidence intervals.