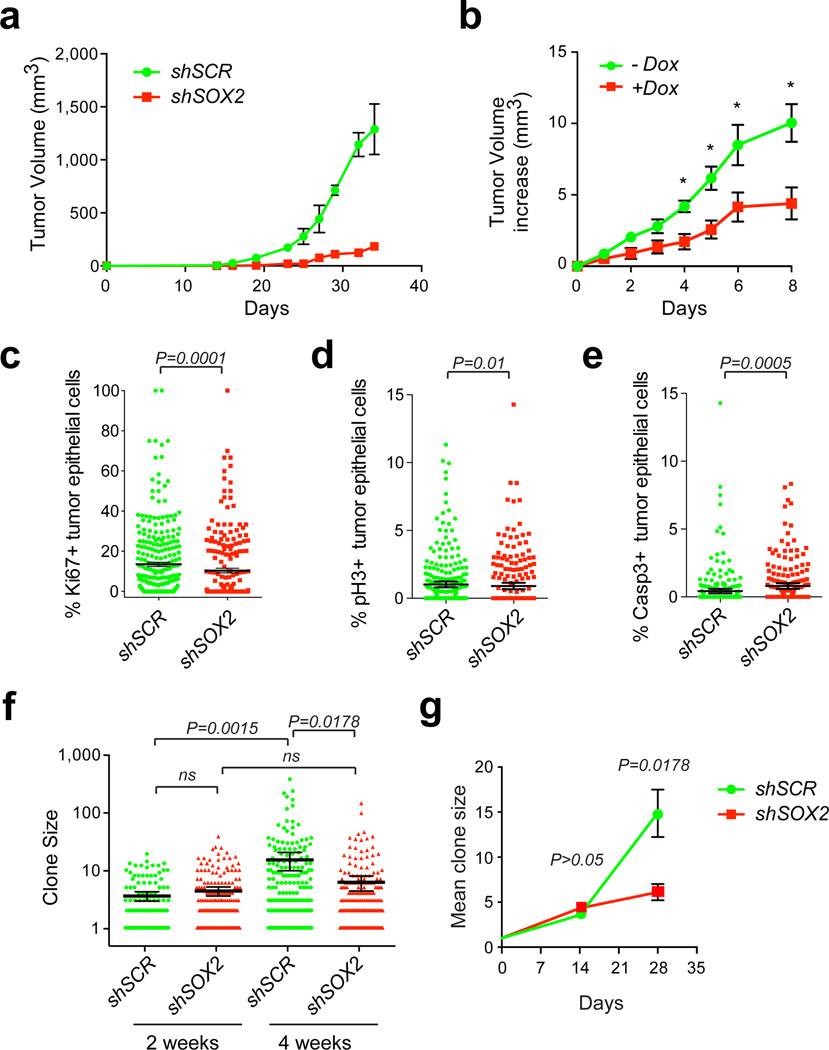
Figure 2. SOX2 is required for cutaneous SCC initiation and growth.
(a) Tumor growth curves of human SCCs infected with lentivirus expressing short hairpin RNA (shRNA) against SOX2 along with nuclear red fluorescent protein (H2B-RFP; shSOX2) or scrambled control shRNA along with nuclear green fluorescent protein (H2B-GFP; shSCR) followed by transplantation onto Nude recipient mice. Data are represented as mean with error bars indicating ± s.e.m. (n=6, *P<0.05, Student’s t-test). (b) Doxycycline-inducible knockdown of SOX2 in established human SCC xenografts. Data are represented as mean with error bars indicating ± s.e.m. (n=10, *P<0.05, Student’s t-test). (c–e) Quantitative analysis of proliferative Ki67 (c), mitotic phospho-Histone H3(Ser10) pH3 (d), and apoptotic activated Caspase-3 (Casp3) (e) positive cells in shSOX2;H2B-RFP or shSCR;H2B-GFP transduced A431 xenografts. Scatter plots illustrate the percentage of infected parenchymal cells that are positive for the respective marker in n>200 microscopic fields. Horizontal bars indicate mean ± 95% CI. (*P<0.05 Mann-Whitney non-parametric t-test). (f–g) Analysis of clonal growth competition assay at 2 and 4 weeks after intradermal transplantation when 1–2% of A431 cells have been transduced with shSOX2;H2B-RFP and shSCR;H2B-GFP (n=6). (f) Scatter plots illustrate clone size distributions. Horizontal lines represent mean with error bars indicating ± 95% CI. (g) Line graphs showing average clone size as a function of time (± s.e.m). (f–g) P values were obtained by Mann-Whitney non-parametric t-tests.

