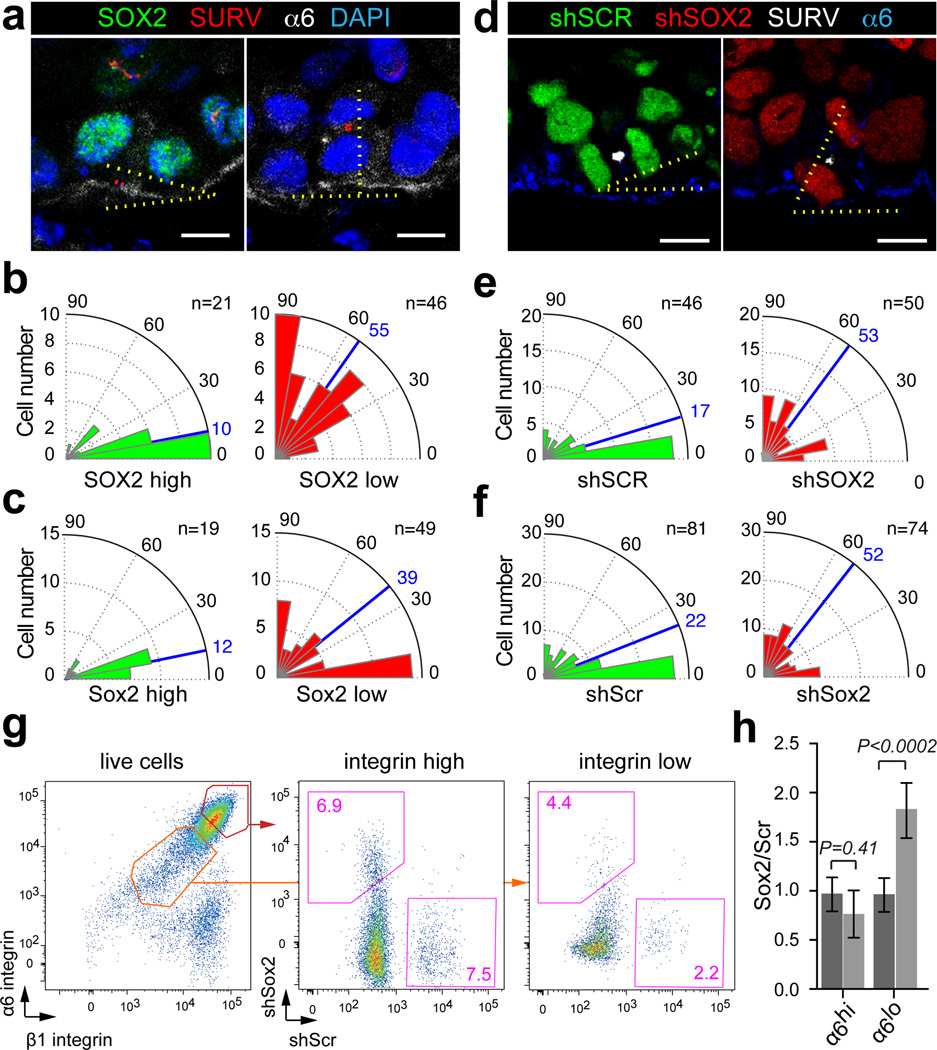
Figure 5. SOX2 expression promotes TIC divisions along the tumor-stroma interface.
(a) Confocal sections of human SCCs stained with SOX2 (green), Survivin (SURV, red), α6-integrin (α6, white) and DAPI (blue). Scale bars indicate 10 µm. (b–c) Radial histograms indicating the orientation of basal cell divisions relative to the tumor-stroma interface expressing high (green) or low (red) levels of SOX2 in human (b) and mouse (c) SCCs. Blue lines indicate median division angles. (d) Projections of representative three-dimensional immunofluorescence micrographs of shSCR;H2B-GFP and shSOX2;H2B-RFP clones in A431 xenografts stained with Survivin (SURV, white), α6-integrin (blue). Scale bars indicate 10 µm. (e–f) Radial histograms describe the orientation of basal cell divisions relative to the tumor-stroma interface in shSCR;H2B-GFP (green) and shSOX2;H2B-RFP (red) clones in human (e) and mouse (f) SCC transplants. Blue lines indicate median division angles. (g–h) Flow cytometric analyses of shSCR;H2B-GFP and shSOX2;H2B-RFP clonal competition assays two weeks after transplantation. (g) Scatter plots illustrate the relative abundance of shSCR;H2B-GFP and shSOX2;H2B-RFP cells within the α6/β1-integrin high and low gates. (h) Bar graphs show mean population size of shSOX2;H2B-RFP and shSCR;H2B-GFP expressing cells within the α6-integrin-high and α6-integrin-low gates with error bars indicating ± s.d (n=6, *P<0.05, Student’s t-test).

