FIGURE 7.
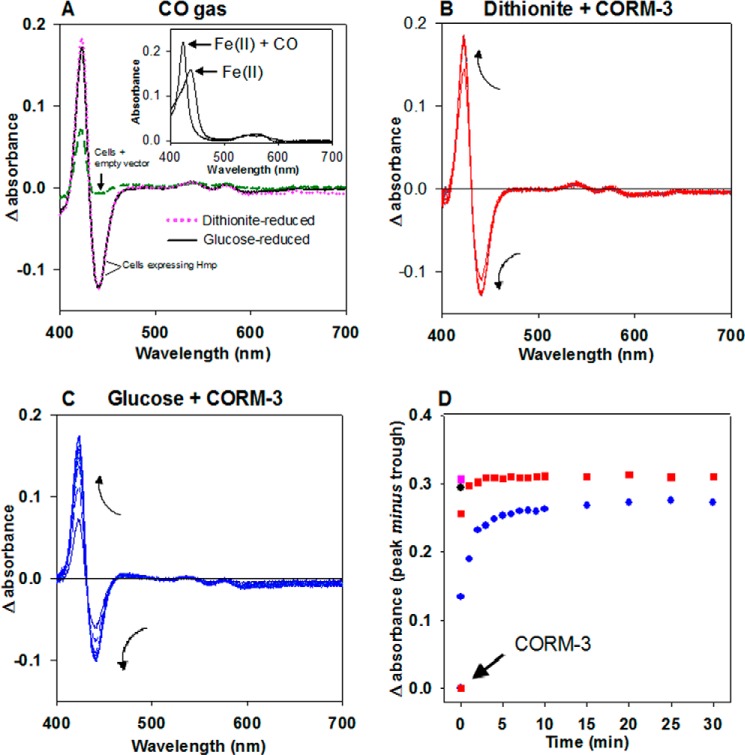
Intracellular formation of CO-reduced Hmp by CORM-3. A, E. coli cell suspensions overexpressing Hmp were reduced with sodium dithionite (magenta dotted line) or glucose (15 mm) (black solid line) and bubbled with CO gas. The difference spectra (CO-reduced minus reduced) were plotted against the difference spectra of glucose-reduced cells carrying the empty vector (dashed green line). The absolute spectra of intracellular glucose-reduced (Fe(II)) and glucose-reduced plus CO gas (Fe(II) + CO) Hmp were obtained by subtraction of the absorbance values of similarly treated cells carrying the empty vector (inset). B and C, cells were reduced with dithionite or glucose, respectively, and supplemented with 300 μm CORM-3. Changes in the spectra were followed every minute for 10 min and every 5 min for an additional 20 min. Arrows indicate the direction of the changes. D, differences in the absorption maxima (peak minus trough) were plotted for every time point. Data from B (red squares) and C (blue dots) were plotted together with the single points from A where the difference in absorbance was obtained from the Hmp-expressing samples reduced with dithionite (magenta square) or glucose (black dot) in the presence of CO gas.

