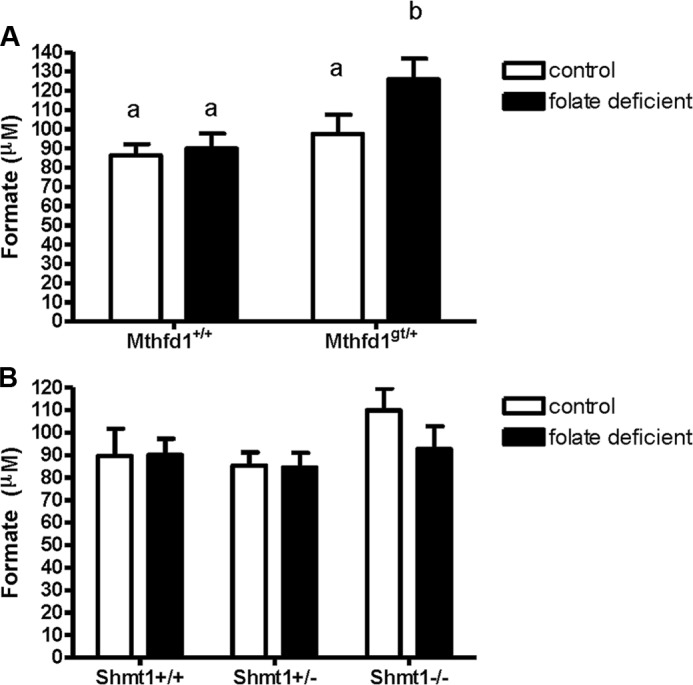
FIGURE 5.

Plasma formate levels as a result of decreased MTHFD1 and SHMT1 expression in mice. A, formate levels from wild-type and Mthfd1gt/+ knockdown mice after 6 weeks consuming control (white bars) or folate-deficient diet (black bars). B, formate levels from wild-type, Shmt1+/−, and Shmt1−/− mice after 6 weeks on control (white bars) or folate-deficient diet (black bars). Data were analyzed using a two-way analysis of variance with a Scheffe post-hoc test for multiple comparisons; groups not connected by the same letter are significantly different (p < 0.05, n = 10 per group; values are shown as the means ± S.E.).
