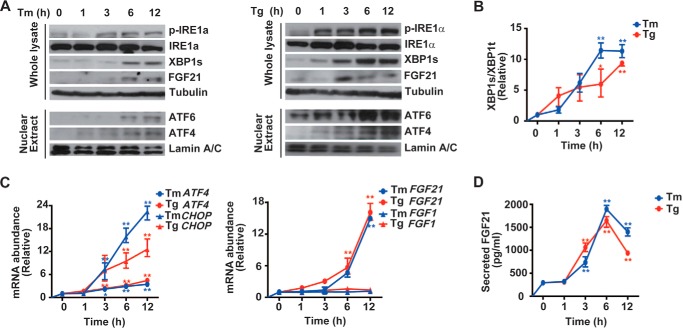
FIGURE 3.
ER stress results in increased expression of FGF21 in HepG2 cells. HepG2 cells were treated with tunicamycin (Tm, 10 μg/ml) or thapsigargin (Tg, 1 μm) for the indicated time intervals. A, ER stress markers and FGF21 protein abundance were analyzed by immunoblotting from whole cell lysates or nuclear extracts as indicated. Shown are representative results from three independent experiments. B and C, Xbp1 mRNA splicing (B) and the mRNA abundance of ATF4, CHOP, FGF21, and FGF1 (C) were determined by quantitative RT-PCR. Results were normalized to the values before Tm/thapsigargin treatment and are shown as the mean ± S.E. (n = 3 independent experiments). *, p < 0.05; **, p < 0.01 by one-way ANOVA. D, secreted FGF21 levels were measured from the culture medium, shown as the mean ± S.E. (n = 3 independent experiments). **, p < 0.01 by one-way ANOVA.

