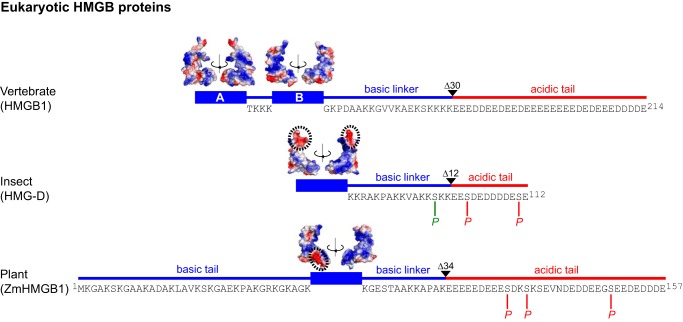
FIGURE 1.
Domain organization of eukaryotic HMGB proteins. Sequences of linker and tail regions are shown. Truncations are indicated by Δ, and the CK2 (red) and PKC (green) phosphorylation sites are indicated by P. Surface electrostatics for the HMG boxes (7–9) were generated in PyMOL (10); acidic patches (see the Introduction) are encircled by dotted lines. The structure of the ZmHMGB1 box (residues 35–112) was derived by homology modeling (see “Experimental Procedures”).

