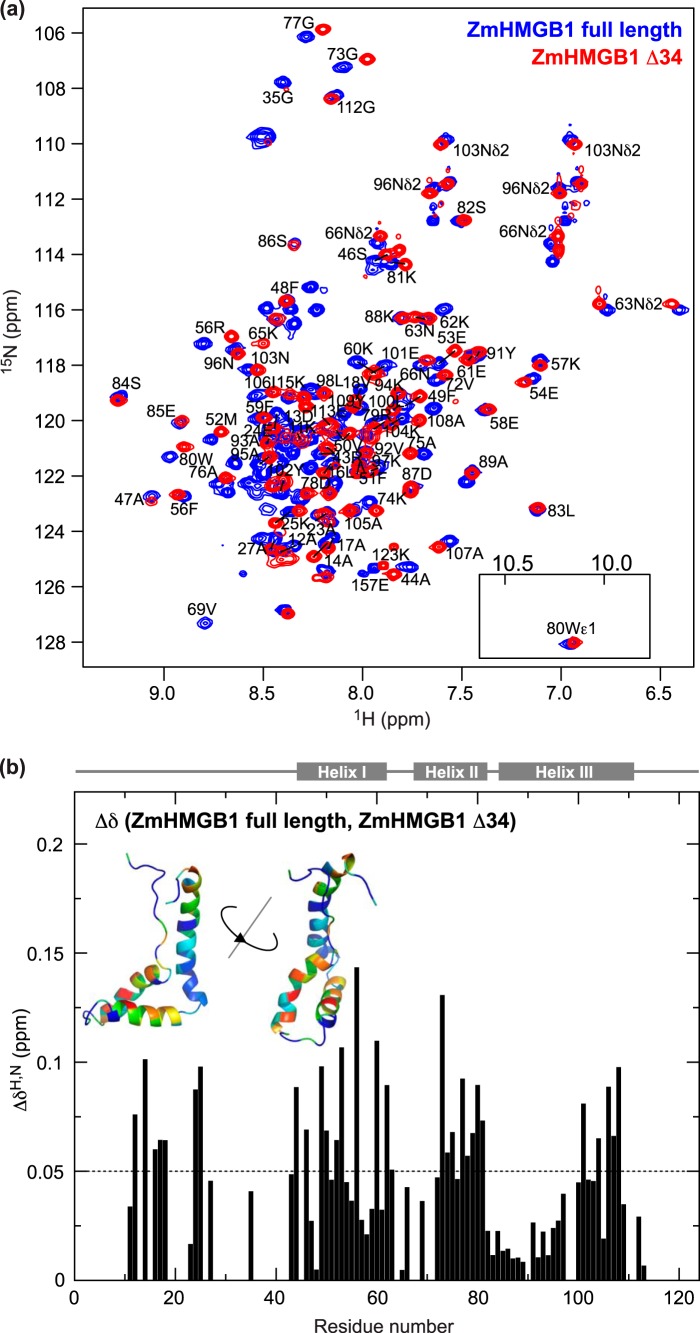
FIGURE 3.
NMR spectroscopy of ZmHMGB1 and ZmHMGB1 lacking the acidic tail (ZmHMGB1 Δ34). a, 15N HSQC spectra. b, chemical shift differences (Δδ = [(ΔδH)2 + (0.15 × ΔδN)2]½ (37)); mean Δδ 0.050 ppm (dotted line). Inset ribbon structures are based on the homology model (see “Experimental Procedures”). Log10(Δδ + 1) was converted to a rainbow color ramp (blue = least shifted, red = most shifted residues).

