
FIGURE 4.
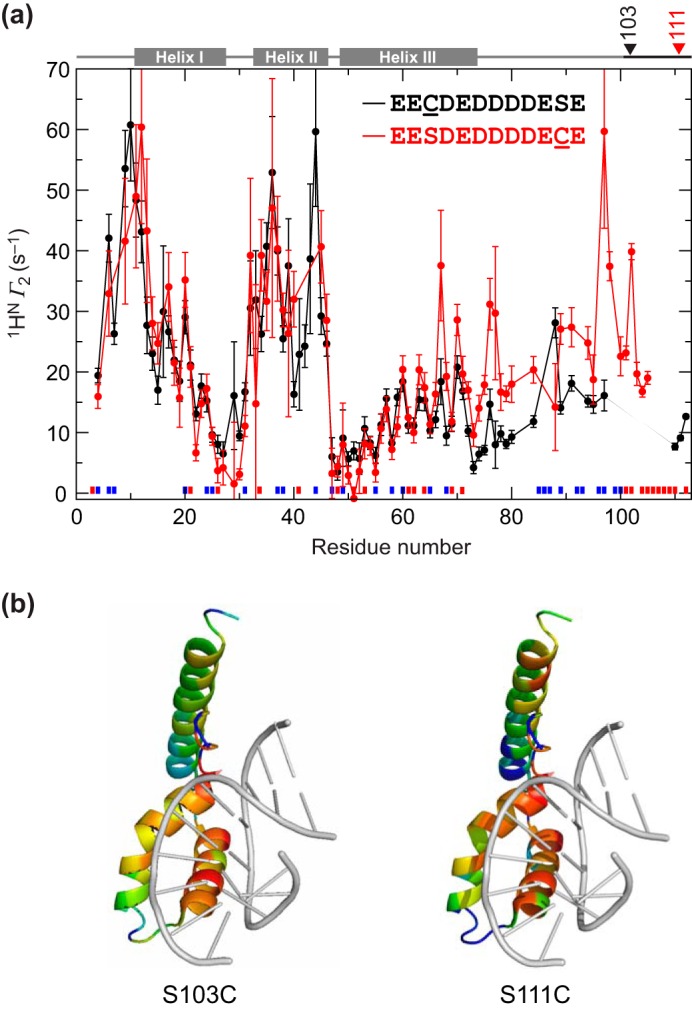
Paramagnetic relaxation enhancement study of HMG-D Ser → Cys mutants. a, PRE values measured as 1HN Γ2; HMG-D S103C is in black, and S111C is in red. Red and blue blocks above the x axis indicate the positions of acidic and basic residues, respectively. b, ribbon structures are based on 1QRV. Log10(Γ2) was converted to a rainbow color ramp (blue = lowest, red = highest) encompassing both the S103C and the S111C datasets; DNA is shown (gray) to demonstrate the similarity between the acidic-tail-binding and DNA-binding surfaces.