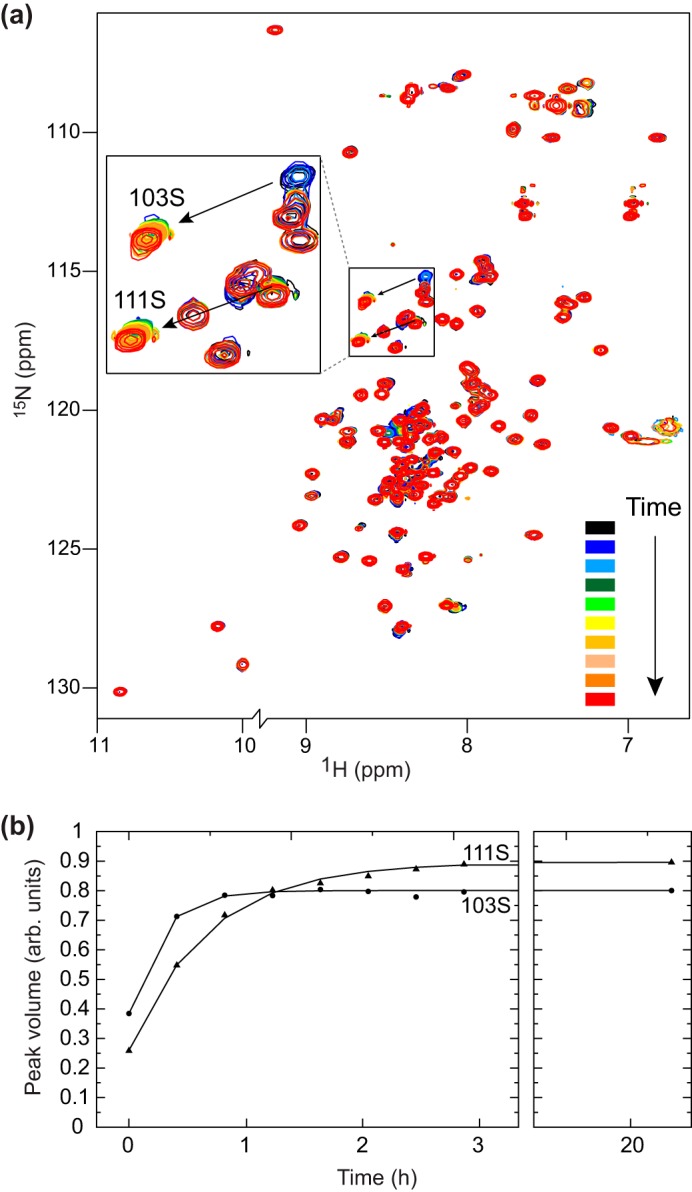
FIGURE 5.

Real-time phosphorylation of 15N-labeled HMG-D monitored by 15N HSQC NMR spectroscopy. a, spectra are colored black through to red to indicate the increasing time. Peaks arising from Ser103 and Ser111 undergo a significant chemical shift change shown by the arrow, indicative of phosphorylation. The intensity of the original peak falls with time, whereas the intensity of the corresponding peak in the new position grows. b, quantification of the intensity of the new peaks seen in a. arb. units, arbitrary units.
