FIGURE 6.
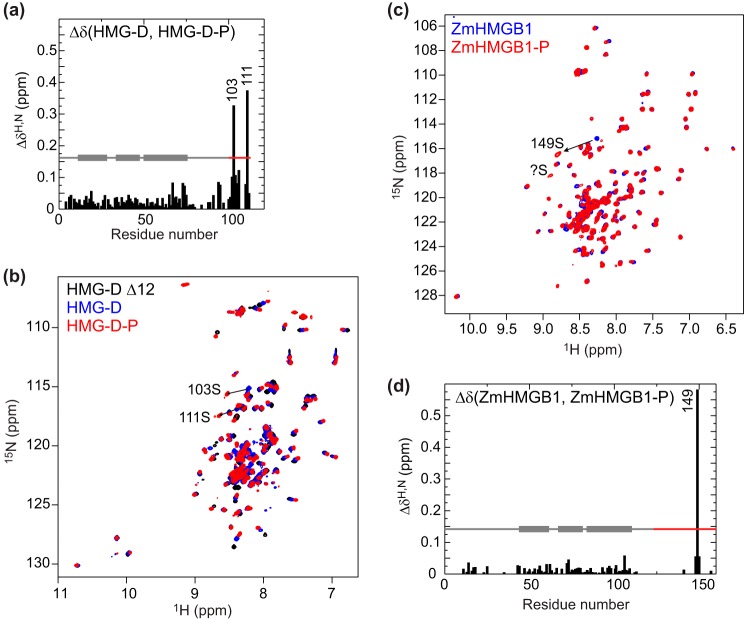
15N HSQC spectra of single-box HMG proteins in the absence and presence of phosphorylation. a, chemical shift differences (Δδ = [(ΔδH)2 + (0.15 × ΔδN)2]½ (37)) between HMG-D and the phosphorylated form, HMG-D-P; Ser103 and Ser111 are phosphorylated (Fig. 5). b, 15N HSQC spectra of HMG-D (blue), HMG-D-P (red), and HMG-D Δ12 (black) for comparison of shift trajectories. c, ZmHMGB1 (blue) and the phosphorylated form, ZmHMGB1-P (red); Ser149 undergoes a significant chemical shift change indicative of phosphorylation, as does another peak that cannot be assigned due to peak overlap in the spectrum of the unphosphorylated protein. d, chemical shift differences as in a.

