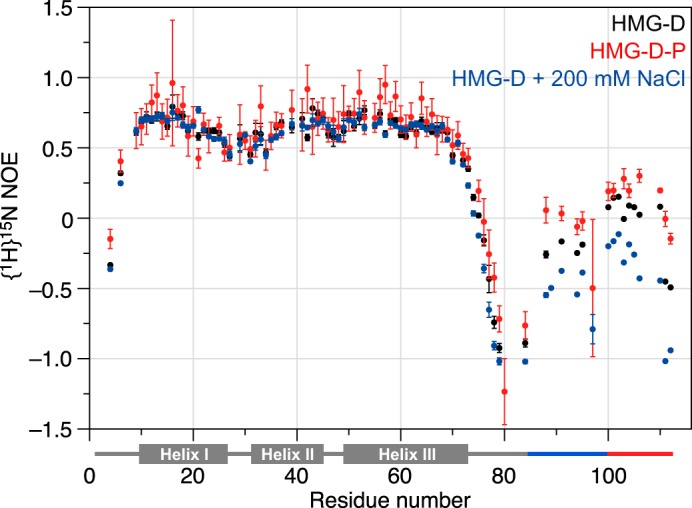
FIGURE 7.

Backbone dynamics of HMG-D (black), HMG-D-P (red) in low salt buffer, and HMG-D in 200 mm NaCl (blue). {1H}15N Heteronuclear NOE values show a reduction in the extent of flexible motions in the N- and C-terminal tail regions upon phosphorylation, whereas the addition of salt results in an increase. (Note: Some error bars for residues in the flexible regions are not visible due to the high signal-to-noise ratio.)
