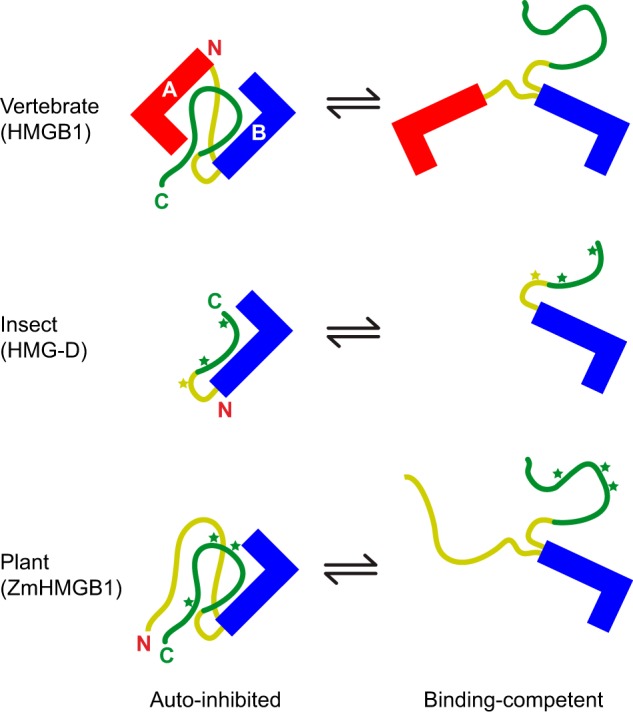
FIGURE 8.

Schematic showing the closed, auto-inhibited versus open, binding-competent forms of the HMGB proteins studied to date. A-type boxes are shown in red, B-type are shown in blue, basic linker regions are shown in yellow, and acidic tail regions are shown in green. Stars indicate sites phosphorylated by CK2 (green) or PKC (yellow).
