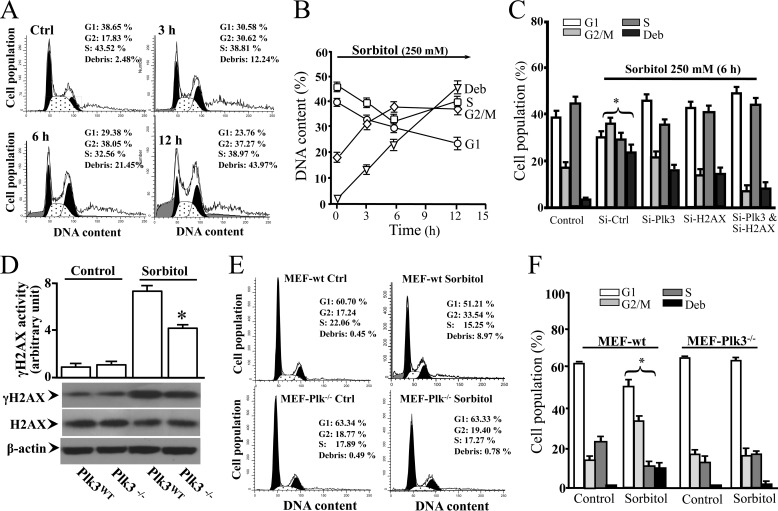
FIGURE 5.
Effect of altered Plk3 activity on cell cycle distribution in hyperosmotic stress-induced HCE cells and MEFs. A, effect of hyperosmotic stimulation on cell cycle progression in HCE cells. B, time course of hyperosmotic stress-induced alteration in cell cycle progression in HCE cells. C, effects of knocking down Plk3 mRNA and/or H2AX mRNA on alterations of cell cycle progress in hyperosmotic stress-induced HCE cells. D, effect of hyperosmotic stress on γH2AX levels in MEFs obtained from wild type (Plk3wt) and Plk3−/− knock-out mice. E, effect of hyperosmotic stimulation on cell cycle progression in Plk3wt and Plk3−/− MEFs. F, comparisons of cell cycle distributions between wild type and Plk3−/− knock-out MEFs in the absence or presence of hyperosmotic stimulation. Asterisk symbols represent a significant difference between hyperosmotic stress-induced control cells and Plk3 and/or H2AX activities suppressed cells (p < 0.05, n = 3).

