
FIGURE 1.
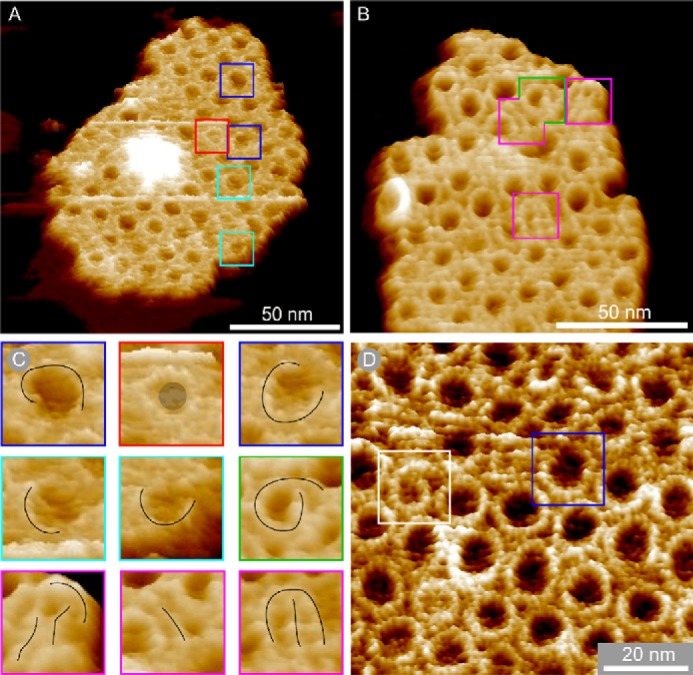
LH1-only membrane patches in three-dimensional representation showing aberrant complexes. A and B, membrane patches produced with no detergent treatment. C, gallery of close-ups of boxed complexes in A and B with black line overlays showing the shape of the aberrant complexes and a gray circle denoting a captured protein in the complex marked with a red box. D, membrane patch prepared using sub-CMC levels of β-DDM. The complex marked with a white box is a spiral, and the complex marked with a blue box is an open ring. The data in B and D have been treated with a low pass filter to reduce noise.