
FIGURE 1.
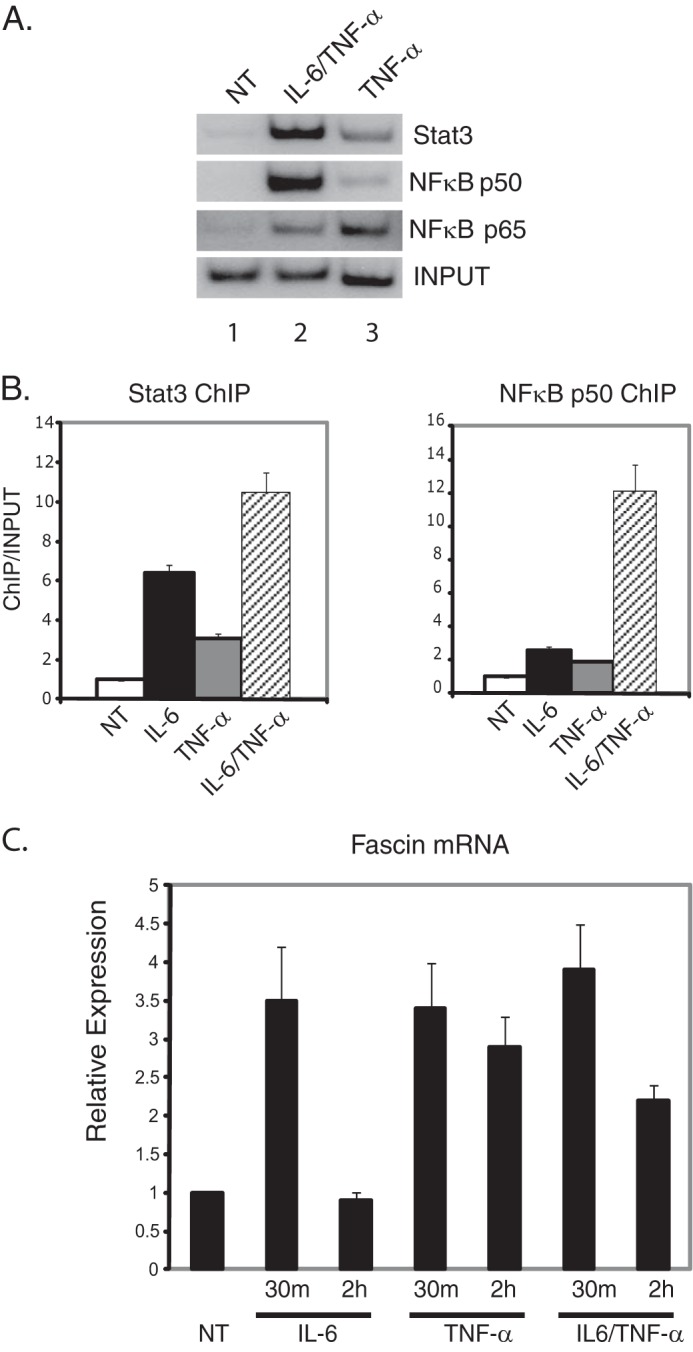
Stat3 and NFκB induce fascin expression in response to IL-6 and TNF-α. A, MDA-MB-231 cells were treated with TNF-α alone or IL-6 and TNF-α combined for 30 min, and ChIP analyses were performed with antibodies against Stat3, NFκB p50, or p65. NT, no treatment. B, quantitation of ChIP assays for MDA-MB-231 cells treated with IL-6 alone, TNF-α alone, or IL-6 and TNF-α combined for 30 min. ChIP analyses were performed for Stat3 or NFκB p50. Gels were quantitated using a phosphorimaging device and expressed as the intensities of ChIP/input with untreated values (NT) set at 1. Results represent the averages and S.D. of at least two experiments. C, cells were serum-starved for 48 h and treated with IL-6, TNF-α, or IL-6 plus TNF-α for 30 min or 2 h. RNA was extracted and subjected to quantitative real-time RT-PCR analyses for fascin. Results are standardized to GAPDH with untreated samples (NT) set at 1. Results represent the averages and S.D. of at least three independent experiements performed in triplicate.