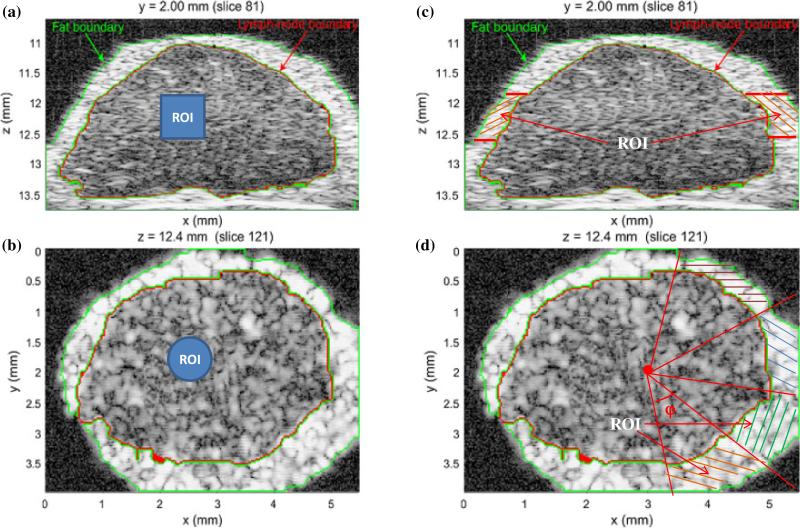
Fig. 2.
(Color online) Illustration of the dimensions and positioning of a cylindrical ROI (solid blue region) in the LN parenchyma in the x–z plane (a) and the x–y plane (b). Similar positioning and ROI size was used to select ROIs in the PBS. The division of the fat layer into angular sections is illustrated by the cross-hatched regions in the x–z plane (c) and the x–y plane (d).

