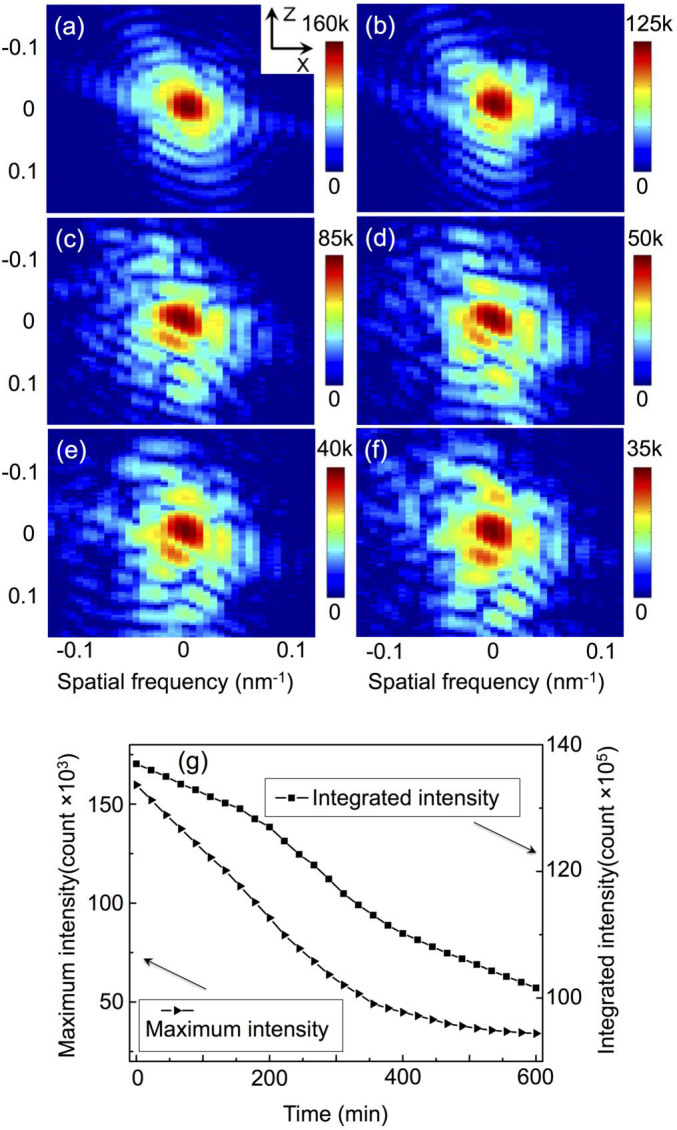
Figure 1.

The patterns at the centre position of the three dimensional rocking curve of the gold (111) diffraction at the copper diffusion time of 0 hr (a), 2 hrs (b), 4 hrs (c), 6 hrs (d), 8 hrs (e), and 10 hrs (f), with a XZ plane view; the time dependence of the maximum diffraction intensity and the integrated diffraction intensity from the BCDI measurements (g).
