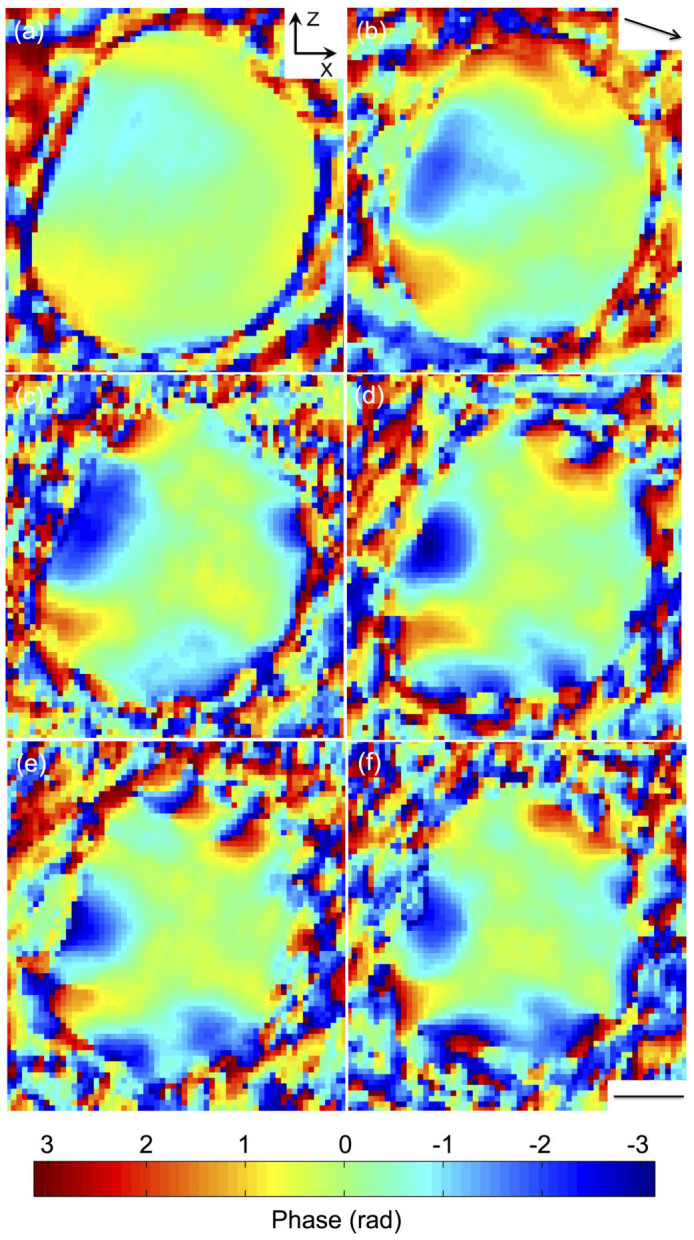
Figure 2. The reconstructed phase images, as cut-off view at the centre of the gold nanocrystal at diffusion time of 0 hr (a), 2 hrs (b), 4 hrs (c), 6 hrs (d), 8 hrs (e), and 10 hrs (f).

Note that the phase becomes very noisy outside the crystal, where the amplitude of the complex density drops to zero. Arrow in (b) shows the Q-vector direction. Scale bar = 100 nm.
