
Supplementary Figure 1.
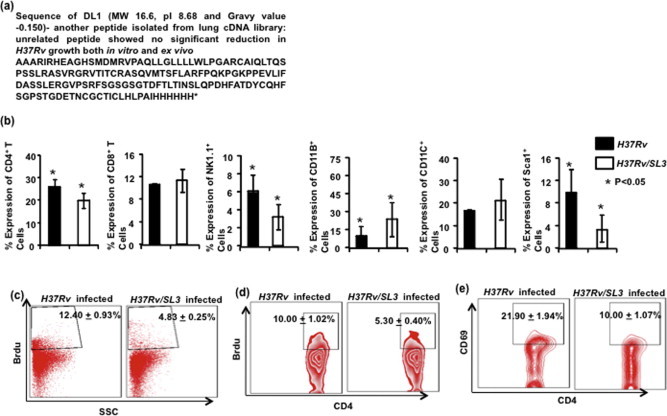
(a) Sequence of control peptide DL1 used as an unrelated peptide control’ in this study. (b) The percentage of Lung T lymphocytes in H37Rv/SL3 and H37Rv infected mice expressing CD4, CD8, Sca1 and NK1.1 is shown in the bar diagram with mean ± STDEV and Student’s T-test (∗p < 0.05). Increased number of Professional APCs, cells expressing CD11B, and CD11C in H37Rv/SL3 infected mice compared to H37Rv infected mice at day 10 after infection, with mean ± STDEV and Student’s T-test (∗p < 0.05). (c and d) T cell proliferation in vivo by Brdu incorporation. Data shown here is representative of three independent experiments with three mice in each group and represents the mean values (∗p < 0.05). (e) The percentage of cells expressing CD69 among CD4+ T cells is shown in the dot-plot with mean having Student’s T-test (∗p < 0.05).