
Supplementary Figure 2.
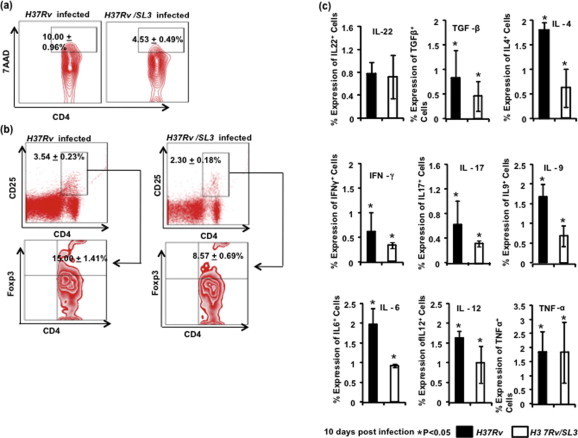
(a) Cell death in CD4+ lung lymphocytes in H37Rv/SL3 and H37Rv infected mice. Data showed in Contour plot with mean having Student’s T-test (∗p < 0.05). (b) The percentage of cells expressing CD25 among CD4+ T cells is shown in the dot-plot with mean having Student’s T-test (∗p < 0.05). CD4+CD25+ T cells gated population was taken to show Regulatory T cells. Data shown in Contour plot with mean having Student’s T-test (∗p < 0.05). (c) Total cytokine production by lung lymphocytes represented through a bar diagram. Data shown with mean ± STDEV; Student’s T-test was applied for estimating significance between two parameters (∗p < 0.05).