
Supplementary Figure 3.
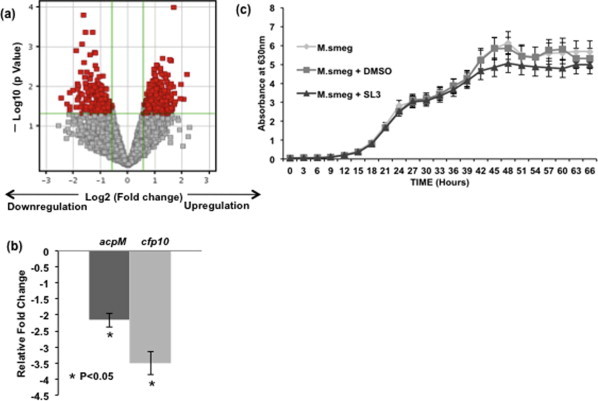
(a) Volcano plot depicting extent of up- and downregulated genes with SL3 expression along with fold change and p-value cut-offs. (b) Relative fold change in the transcript levels of ACPM (fold change: – 2.16) and CFP10 (fold change: – 3.51) genes in Real-time PCR experiment. (c) M. smeg, M. smeg +SL3 and M. smeg + DMSO were inoculated in triplicates in vitro and growth was recorded spectrophotometrically for 66 h at 630 nm. SL3 addition did not show any significant differences in growth pattern during the initial log phase.