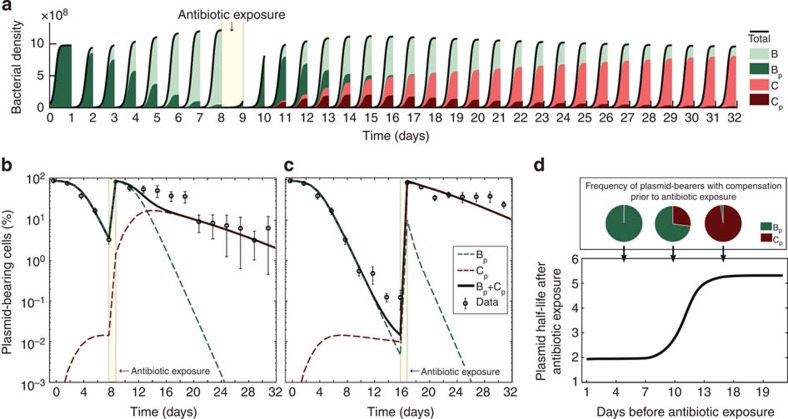
Figure 4. Compensatory adaptation and positive selection interact to stabilize the plasmid.
(a) Simulated bacterial densities as a function of time in an experiment of duration 32 days, with drug deployed at day 8. The colour of each area denotes the frequency of each sub-population: plasmid-bearing parental strain in dark green, plasmid-free parental in light green, compensated plasmid-bearer in dark red and compensated plasmid-free in light red. (b,c) Relative proportion of plasmid-bearing bacteria (logarithmic scale) as a function of time. The solid black line represents the total expected frequency of plasmid bearers, while the red- and green-dotted lines denote the expected frequency of plasmid-bearing cells with and without the compensatory mutation. Circles represent the observed frequency of plasmid-bearing cells over time (average±s.d., n=3). Note how after antibiotic exposure at day 8 (b) or 16 (c) the plasmid-bearing population returns to 100% but with a different expected population structure than at the beginning of the experiment, and there is decay in the rate of plasmid loss in the population. (d) Expected plasmid half-life after antibiotic exposure as a function of the number of days elapsed before a single-day of antibiotic is used. If the drug is used early, then the population is composed mainly of the ancestral strain (illustrated in green in the pie chart above), while if there is a large delay before using the antibiotic then the plasmid becomes more stable because the population is now mostly composed of the compensated bacterial type (in red).

