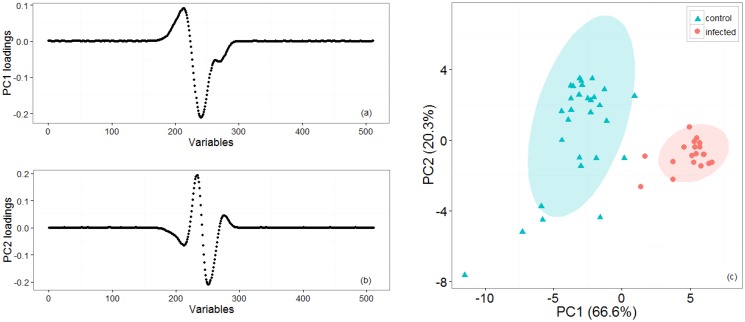
Figure 6.
Fourth set of experiments: Loading plots (a, b) for the two first principal components that account for most of the variance. (c) PCA and k-means clustering for two groups of potato tubers with controls (cyan triangles) and infected (red circles) which have been grouped with 95% confidence ellipses around the centroid identified by the k-means algorithm.

