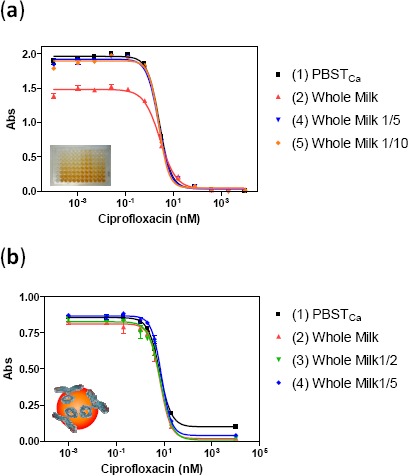
Figure 4.

Milk matrix effect using (a) ELISA and (b) m-ELISA for the TEf. Curves were built in (1) PBSTCa buffer, (2) Whole milk, (3) Whole milk diluted two times in PBSTCa buffer, (4) Whole milk diluted five times in PBSTCa buffer and (5) Whole milk diluted 10 times in PBSTCa buffer. Each point was the average of at least three-well replicates, and the assays were run on two different days.
