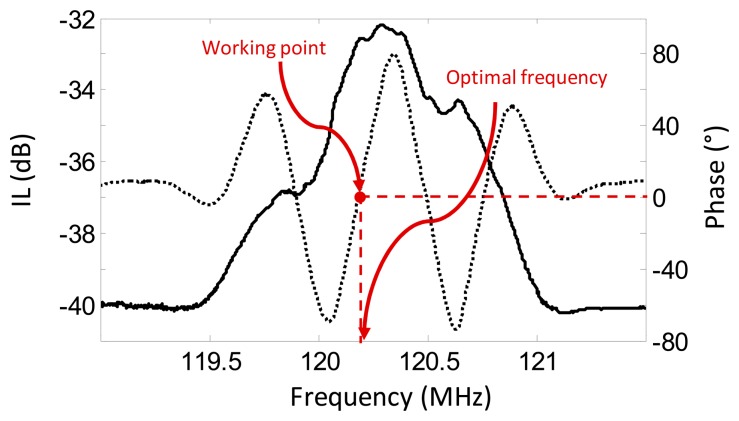
Figure 8.
Frequency response of the LW sensor mounted in the fabricated flow-through cell and loaded with water. The measurement was obtained with the electronic characterization system. The solid line represents the IL loss and the dotted line represents the phase. The red spot indicates the working point that it is used for determining the optimal operation frequency of the sensor.

