
Figure 2.
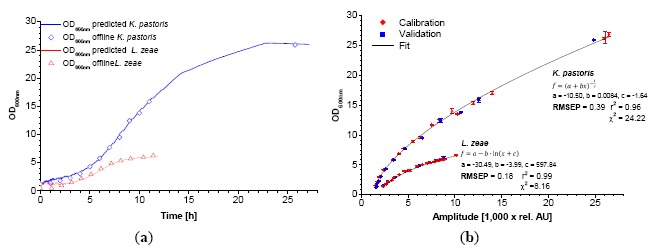
Exemplary dynamic calibration of the biomass sensor signal versus optical density at λ = 600 nm for K. pastoris and L. zeae (a). Red diamonds represent two experiments. Blue squares represent one validation experiment. Application of the calibration function on the biomass sensor signal of the validation growth curve along with the offline measured data (b).