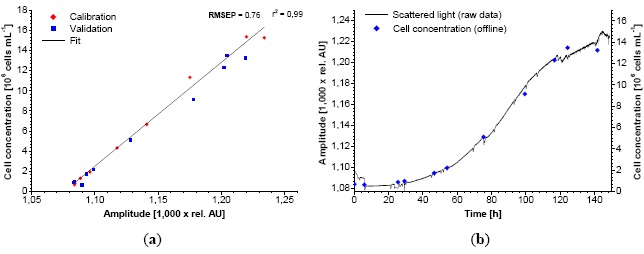
Figure 7.

Calibration of the biomass sensor signal versus cell concentration using Chinese hamster ovary (CHO)-K1 and a special light shade. Red diamonds represent two experiments. Blue squares represent 1 validation experiment (a). Comparison between the biomass sensor signal and offline cell counting (Cedex) during the growth of CHO-K1 (b).
