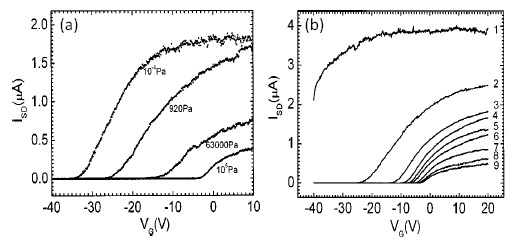
Figure 6.

(a) Channel current vs. gate voltage under different oxygen pressures. (b) Curve 1 was obtained under ultraviolet illumination with an oxygen pressure of 105 Pa. Curve 2–9 were obtained 1, 3, 5, 6, 9, 14, 20, 26 min after turning of the ultraviolet light, respectively. In these measurements, the bias voltage is 2 V. Reprinted from reference [86] with permission from AIP Publishing.
