
Figure 2.2.1.
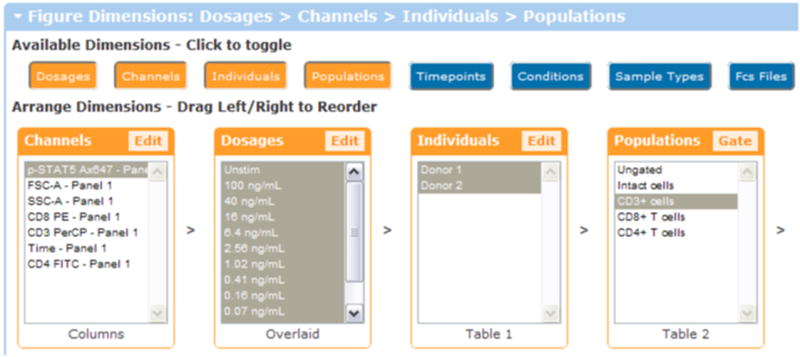
Setup of the figure dimensions for a histogram overlay comparing dosages. When the plot type is a histogram overlay, the second dimension is “Overlaid”, which means that it forms the overlaid peaks within the histogram overlay. Usually the overlaid dimension compares conditions, individuals, timepoints, or dosages.