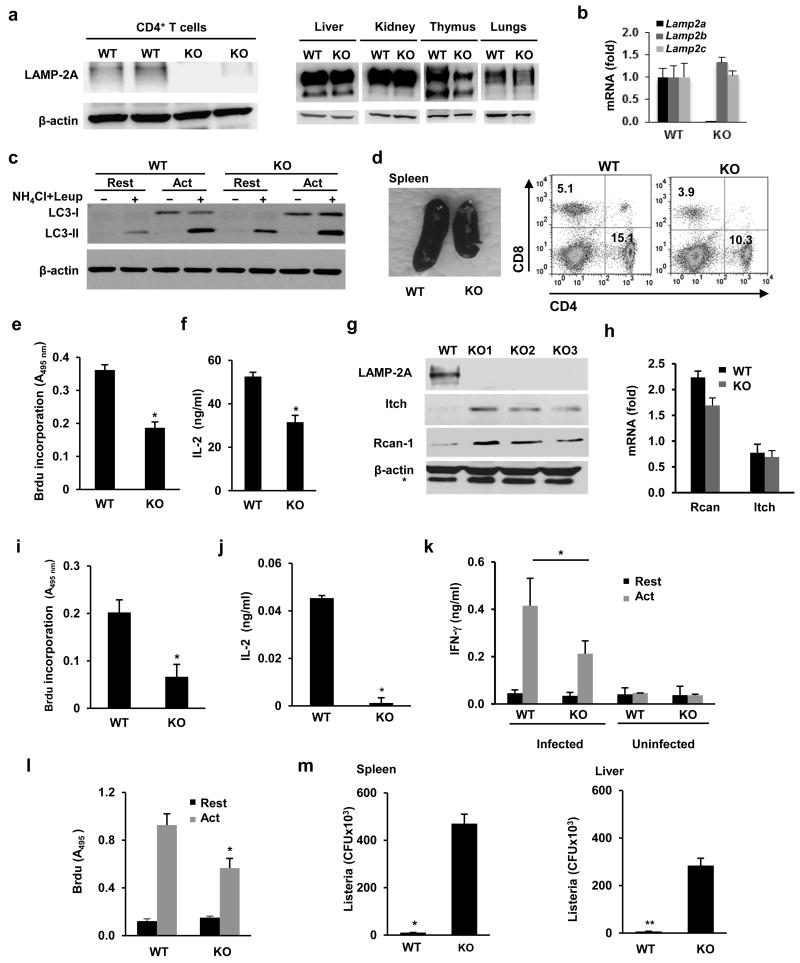
Figure 4. Reduced T cell responses in CMA-deficient mice.
(a) Immunoblot of LAMP-2A in CD4+ T cells, liver, kidneys, thymus and lung of L2A-cKO (KO) mice or wild type littermates (WT). (b) Lamp2a, b and c mRNA expression (mean+s.e.m, expressed as relative to WT values) measured by qPCR in T cells from WT or L2A-cKO mice (n=3). (c) Macroautophagy flux (LC3 flux) measured in resting CD4+ T cells from WT and KO mice or cells activated with anti-CD3 and anti-CD218 for 24 hours (Act). (d) Representative image (from 6 different mice) of spleens from WT and L2A-cKO mice. Distribution of peripheral CD4+ and CD8+ T cells was determined by FACS. (e-f) Cell proliferation and IL-2 production measured in CD4+ T cells isolated from spleens of WT and KO mice following stimulation for 48 hours. Results are mean+s.e.m. of 4 (e) 6 (f) independent experiments (t test, (e) *p=0.0062; (f) *p=0.006). g. Immunoblot of Itch and Rcan-1 proteins in total lysates from activated (24 hours) CD4+ T cells of 3 different KO mice compared to WT littlermate controls. * Non-specific band. (h) Expression of Lamp2a mRNA assessed by qPCR in samples obtained from resting or activated for 24 hours CD4+ T cells isolated form WT or KO mice Data (mean+s.e.m. from 3 different experiments) is presented as fold induction of mRNA expression following activation. (i-j) Recall responses to OVA323-339 peptide (cell proliferation and IL-2 production) in draining lymph nodes isolated from OVA323-339-immunized KO mice and WT littermates. Results are mean+s.e.m. from 4 different experiments (t test; (i) *p=0.0054; (j) *p=0.0052). (k-l) Recall responses (cell proliferation and cytokine production) to Listeria in CD4+ T cells isolated from naïve or previously infected WT or KO mice. Graphs show mean+s.e.m. from 6 mice analyzed in two independent experiments (t test; (k) *p=0.032; (l) *p=0.02). (m) Listeria CFU in spleen and liver measured in previously immunized WT and KO mice after reinfection with a high dose of Listeria. Results show mean+s.e.m. from data obtained in triplicate from three different mice (t test; *p=0.008; **p=0.001).

