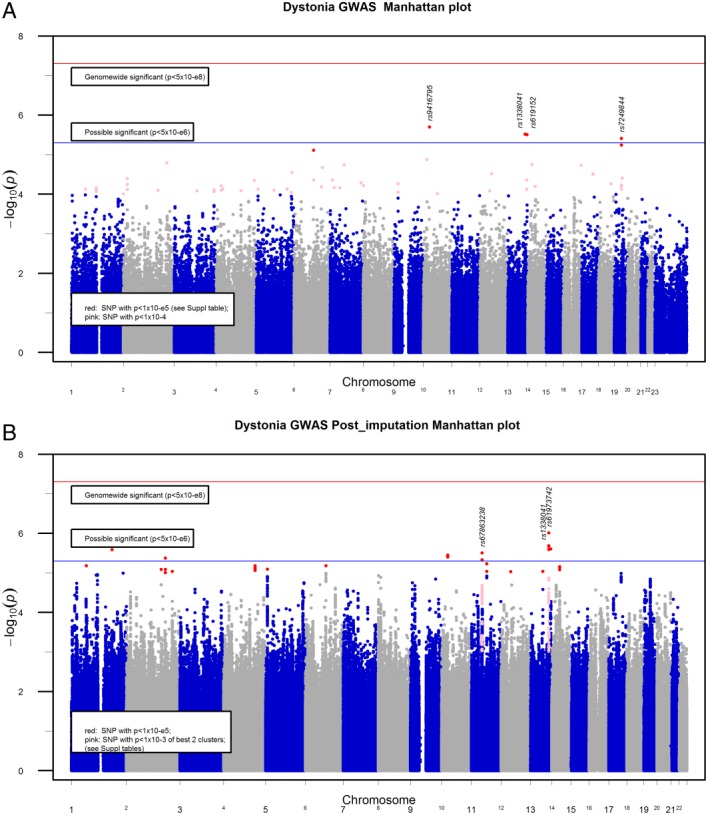
Figure 1.

(A) Manhattan plot of GWAS. (B) Manhattan plot of imputed result. The SNPs with P < 0.001 in the best 2 regions were labeled in pink, showing clustering of SNPs around the regions. GWAS, genomewide association study; SNP, single-nucleotide polymorphism. [Color figure can be viewed in the online issue, which is available at wileyonlinelibrary.com.]
