Figure 3.
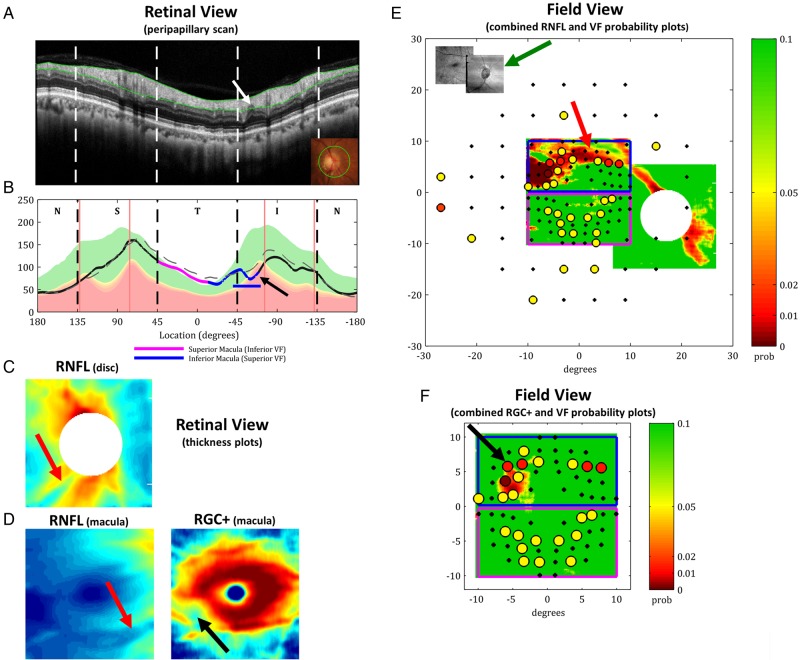
The single-page spectral domain optical coherence tomography report for Patient 3 showing (A) an enlarged averaged circle scan in NSTIN view as in figure 2A, (B) the corresponding retinal nerve fibre layer (RNFL) thickness as in figure 2B, (C) the 2D RNFL thickness from the 3D disc scan, (D) the 2D RNFL (left) and retinal ganglion cell (RGC)+ (right) thicknesses from the 3D macular scan, (E) the co-registered macular and disc 2D RNFL thickness probability plots in field view with the 24-2 and 10-2 visual field (VF) test point probabilities superimposed (see colour bar) with an inset of the co-registered shadowgrams of the 3D scans (green arrow), and (F) the macular 2D RGC+ thickness probability plot in field view with the 10-2 VF test point probabilities superimposed (see colour bar) as in (E).

