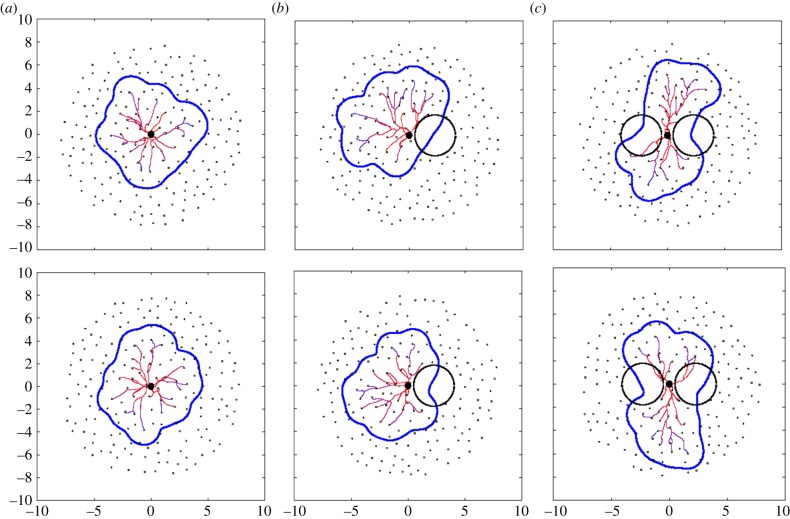
Figure 3.
Examples of typical vascular tree predictions in the considered scenarios: (a) control, (b) disrupted (10 arteries blocked), (c) bipartite (20 arteries blocked symmetrically according to cord insertion). The spiral arteries are depicted as black dots, blocked region by a black circle, vascular tree and estimated placental shape by solid lines. (Online version in colour.)

