Figure 6.

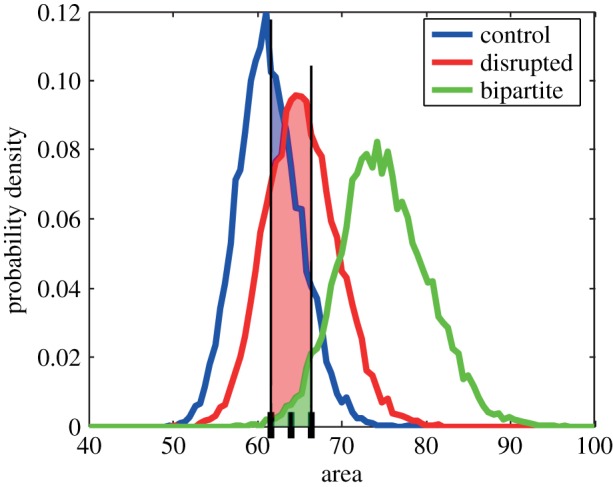
An illustration of probability estimation based on the surface underneath probability distribution function in each scenario (note that regions do overlap). (Online version in colour.)

An illustration of probability estimation based on the surface underneath probability distribution function in each scenario (note that regions do overlap). (Online version in colour.)