Abstract
The mechanical interaction between Schwann cells (SCs) and their microenvironment is crucial for the development, maintenance and repair of the peripheral nervous system. In this paper, we present a detailed investigation on the mechanosensitivity of SCs across a physiologically relevant substrate stiffness range. Contrary to many other cell types, we find that the SC spreading area and cytoskeletal actin architecture were relatively insensitive to substrate stiffness with pronounced stress fibre formation across all moduli tested (0.24–4.80 kPa). Consistent with the presence of stress fibres, we found that SCs generated large surface tractions on stiff substrates and large, finite material deformations on soft substrates. When quantifying the three-dimensional characteristics of the SC traction profiles, we observed a significant contribution from the out-of-plane traction component, locally giving rise to rotational moments similar to those observed in mesenchymal embryonic fibroblasts. Taken together, these measurements provide the first set of quantitative biophysical metrics of how SCs interact with their physical microenvironment, which are anticipated to aid in the development of tissue engineering scaffolds designed to promote functional integration of SCs into post-injury in vivo environments.
Keywords: Schwann cell, cell mechanics, traction force microscopy
1. Introduction
The biophysical capabilities of Schwann cells (SCs) in the context of their in vivo-like mechanical environments have remained understudied until now. SCs in the body require the maintenance and versatility of their bipolar phenotype across a range of biomechanical environments to perform their functions. They play a pivotal role in the development, maintenance and regeneration of axons in the peripheral nervous system (PNS) [1–3]. SCs are derived from neural crest cells and can either be myelinating or non-myelinating [3]. In a process called ‘radial sorting’ during development of peripheral nerves, SCs associate with, and segregate axons based on their thickness (figure 1a). After sorting is complete, myelin sheaths are deposited by SCs around axons that are larger than 1 μm in diameter. This provides axons with the required insulation for fast moving, saltatory conduction of electrical signals [4] (figure 1b). After injury in the PNS (figure 1c), SCs present at the distal stump of the nerve become activated, and migrate to the injury site. There, they enter mitosis, mitigate Wallerian degeneration and provide axons with a path to grow along by forming an aligned trail of bipolar cells, commonly referred to as bands of Büngner [5,6]. In injuries, even at the scale of millimetres, endogenous SCs respond and are capable of guiding nerve fibres towards the distal stump (figure 1c). Moreover, although naturally not found in the central nervous system, transplantation of exogenous SCs into the brain [7] or the spinal cord [8,9] has promoted axonal regeneration. The means by which SCs accomplish successful migration and morphological organization across these scenarios remain unknown. Understanding the mechanosensitive behaviour of SCs in tailorable mechanical environments could play an important role in guiding scaffold designs to promote efficient functional integration of SCs in vivo.
Figure 1.
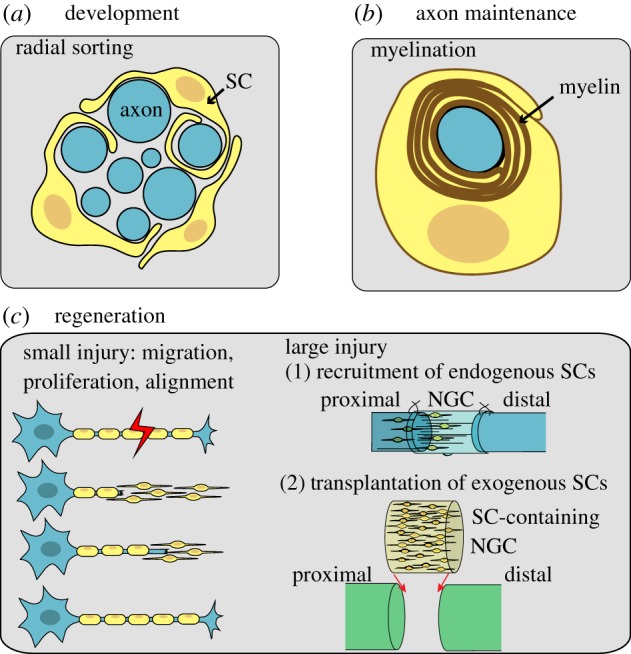
SCs perform a range of functions in the body. (a) During development, SCs sort axons based on their diameter and (b) deposit myelin on larger axons to increase conduction velocity of action potentials. (c) SCs aid axon regeneration by migrating into an injury site after a small injury, or into a transplanted nerve guidance channel (NGC) after a large injury. Once there, SCs proliferate and align. NGCs can also be pre-seeded with exogenous SCs to enhance regeneration. (Online version in colour.)
It is known that not only do cells interact with their environment biochemically, but also physically; for example, substrate stiffness modulates cell functions such as cell adhesion, motility and spreading [10–14]. While the role of substrate stiffness on SCs has begun to be acknowledged [15], here we present an experimental system of significance to the nervous system environment, in its investigation of stiffnesses relevant to the nervous system, mediated by laminin, a molecule present in developmental peripheral axon tracts and upregulated following injury. To gain insights into this physical interaction, we investigated and quantified the three-dimensional tractions, cell morphologies and cell spreading behaviour of SCs on polyacrylamide (PA) gels ranging in stiffness from 0.24 to 4.80 kPa. This range is consistent with reported stiffnesses in the nervous system [16,17]. We also characterized the correlation of morphology with substrate stiffness, because SCs are reported to exhibit different types of morphologies in vitro [18,19]. Interestingly, we found that the bipolar morphology, the most common morphology in vivo, is the most prevalent across all stiffnesses in our study.
Perhaps our most striking finding is the observation of similar cytoskeletal architecture with the existence of pronounced actin stress fibres across all elastic moduli tested, even on moduli as soft as 0.24 kPa. Because the formation and existence of stress fibres usually indicates a highly contractile stress state, we quantified the three-dimensional displacement and traction signature of SCs as a function of substrate stiffness. Using a recently reformulated three-dimensional traction force microscopy (three-dimensional TFM) approach capable of accounting for finite material deformations, we found that on the most compliant PA gels, SCs generate strains large enough to cause significant substrate surface deformations, highlighting the contractile capability of these cells. By analysing the spatial distribution of the three-dimensional SC displacement and traction fields, we found that SCs generate highly localized out-of-plane moments and that their size, distribution and characteristics are similar to recent findings for mouse embryonic fibroblasts [20]. Taken together, these results provide important insights into the mechanocharacteristics of SCs that should be considered in the design of regenerative tissue engineering scaffolds and nerve conduits.
2. Material and methods
2.1. Three-dimensional traction force microscopy
Cell-generated full-field displacements and tractions were computed using our recently developed large deformation three-dimensional traction force microscopy (three-dimensional LDTFM) method [21]. Briefly, three-dimensional timelapsed volumetric images of fluorescent beads embedded in PA substrates were recorded using laser scanning confocal microscopy (LSCM). A new fast iterative digital volume correlation (FIDVC) algorithm was used to track the motion of the embedded fluorescent beads in all three dimensions between each time increment [22]. Owing to the spatial refinement of the subvolume correlation windows, the FIDVC is capable of capturing large nonlinear displacement fields with high spatial resolution while maintaining low computation times (≈1.5 min per time increment for a typical image size of 512 × 512 × 160 voxels). The final subvolume spacing, the parameter that controls the displacement spatial grid resolution, was set to eight voxels (≈3.3 μm for in-plane measurements and 2.4 μm for out-of-plane measurements).
After the full-field displacements, u, were determined, the deformation gradient tensor, F, of the substrate is calculated via finite differentiation. Extra precaution is taken to choose a differentiation kernel that mitigates sampling de-aliasing errors and measurement noise. The differentiation kernel we used in this study is an optimal-9 tap filter described in detail by Farid et al. [23]. The computation of F is necessary to accurately calculate the Cauchy stress tensor, σ, because for large deformations, as those seen in this study, the reference and deformed configurations are no longer identical [21]. For this reason, Hooke's law of linear small-strain elasticity used in most previous studies [24–28] is replaced by a neo-Hookean finite deformation material model [29]. The relation between the Cauchy stress (σ) and the deformation gradient (F) is mathematically expressed [29] as
| 2.1 |
where the parameters μ and K are the shear and bulk modulus for PA. By using our mechanical characterization results (see the electronic supplemental material), we can relate these quantities to the elastic modulus and Poisson's ratio of the material by
| 2.2 |
The quantities, J and B are the Jacobian of F, and the left Cauchy–Green deformation tensor, respectively. They are mathematically expressed as
| 2.3 |
and
| 2.4 |
The tractions acting on the deformed surface, T, with surface normals n are calculated via the Cauchy relationship,
| 2.5 |
The root-mean-squared tractions, TRMS, are defined as
 |
2.6 |
where Ti, is the traction vector located at every ith point along the surface within the boundary, enclosing N points (see the electronic supplementary material, figure S2). More details about the computation of the RMS integration boundary can be found in the electronic supplemental material.
Before proceeding to calculate the tractions (T), we must first determine the true surface normals (n). In brief, we take advantage of the spatial locations of the embedded fluorescent beads in the raw LSCM images. A scattered data representation of the surface is built by finding the local maximum height of the bead locations using a sliding window. After least-squared fitting and surface gradient smoothing [30], the normals were calculated from a Delaunay triangulation of the surface. The subsequent surfaces in the timelapse were computed by translating the surface points in the reference configuration via the displacement field calculated from the FIDVC algorithm.
Finally, to calculate the work done by the cell to elastically deform the substrate, we compute the strain energy between time increments as the volume integral of the strain energy density  , i.e.
| 2.7 |
For a neo-Hookean solid, the strain energy density is given by [29]
| 2.8 |
2.2. Fabrication of polyacrylamide gels
Thin films of different PA gels were prepared from 40% (w/v) acrylamide (BioRad Laboratories, Hercules, CA) and 2.5% (w/v) N,N′-methylene-bis-acrylamide (BIS, BioRad Laboratories) stock solutions as described previously [13,27,31] with 20% (w/v) red fluorescent microspheres (0.5 µm in diameter, carboxylate-modified, Life Technologies, Grand Island, NY). The final acrylamide–BIS concentration ratios, 3.0–0.08%, 3.0–0.2% and 5.0–0.1% produced PA gels with elastic moduli of 0.24, 1.70 and 4.80 kPa, respectively (see the electronic supplementary material, figure S1). Cross-linking was initiated by the addition of 0.125% ammonium persulfate (APS, Sigma-Aldrich, St Louis, MO) and N,N,N′,N′-tetramethylethylenediamine (TEMED, Life Technologies). The PA gel solution was vortexed for 30 s and 20 µl of PA solution was pipetted onto the surface of a microscope slide and sandwiched with an activated glass coverslip (25 mm in diameter, Thermo Fisher Scientific, Waltham, MA), yielding a final gel thickness of approximately 40–60 µm.
PA gels were chemically functionalized with laminin (LN, Life Technologies) using the heterobifunctional cross-linker sulfosuccinimidyl 6-(4′-azido-2′-nitrophenylamino)hexanoate (sulfo-SANPAH, Thermo Fisher Scientific) to promote cell adhesion [27,31]. After removal of the excess water, 100 µl of sulfo-SANPAH (1 mg ml−1) was deposited onto the surface of each sample, and irradiated with ultraviolet light for 15 min to initiate activation. The darkened sulfo-SANPAH solution was aspirated, and the procedure was repeated. The samples were rinsed three times with 1× phosphate-buffered saline (PBS, Life Technologies) and their surfaces covered with 0.2 mg ml−1 LN in Hank's balanced salt solution (Life Technologies) overnight at 4°C. Excess LN was removed, and gels were rinsed three times with PBS for 10 min before cell deposition.
2.3. Cell culture
All cell culture reagents were from Life Technologies, unless otherwise stated. SCs from adult rat sciatic nerve (generous gift from Dr Mary Bunge, University of Miami, Coral Gables, FL) were cultured on tissue culture plastic flasks pre-coated with 100 µg ml−1 poly(l-lysine, PLL, Sigma-Aldrich) in Dulbecco's modified Eagle's medium with 10% fetal bovine serum, 4 mM l-glutamine, 100 µg ml−1 penicillin and 100 µg ml−1 streptomycin supplemented with 2 µM forskolin (Sigma-Aldrich), 10 µg ml−1 bovine pituitary extract (Sigma-Aldrich) and 2 µM heregulin (Genentech, San Fransisco, CA; SC medium). Cells used in experiments were between passages 5 and 9. Cultured cells were maintained in a humidified chamber at 37°C with 5% CO2. Cells were trypsinized using 0.25% trypsin and seeded in SC medium on functionalized gels at a density of 950 SCs cm−2 for 3 h to allow for cellular attachment. Cell-labelling solution, Vybrant DiD (far red, 30 µl ml−1 of SC medium) was applied to each sample for 30 min at 37°C and 5% CO2 followed by three rinses with medium for 10 min at 37°C and 5% CO2.
2.4. Confocal microscopy
After an initial seeding period, three-dimensional image stacks of individual SCs on PA gels were acquired using a Nikon A-1 confocal system mounted on a TI Eclipse inverted optical microscope controlled by NIS-Elements Nikon Software (Nikon, Tokyo, Japan). The temperature in the microscope chamber was controlled and regulated to 37°C using a feedback-controlled heater (Air-Therm heater, World Precision Instruments Inc., Sarasota, FL). PA gel samples containing stained SCs were mounted into a Chamlide magnetic chamber (Live Cell Instrument, Seoul, Korea), filled with SC medium and placed in the microscope chamber where 5% CO2 was injected. All samples had an equilibration time of 1 h before the start of the timelapse experiments to avoid thermal drift. A 40× CFI APO Lambda S water objective with a numerical aperture of 1.25 was used in all experiments. The green fluorescent microspheres used as fiducial markers were excited with an argon ion laser (488 nm), and the fluorescent cell membrane label was excited with a Diode (640 nm) laser. Confocal image stacks of size 512 × 512 × 160 voxels (212 × 212 × 48 µm3) were acquired every 10 min for 1 h (see the electronic supplementary material, movie S1). For all cases, the area surrounding a cell was scanned to ensure the selection of an isolated cell. Experiments for each stiffness were performed in triplicate, and at least 15 cells were recorded per experiment. Cellular surface outlines were determined either from phase images or from fluorescent membrane labels.
2.5. Fluorescence staining
All reagents were from Life Technologies, unless otherwise stated. Unlabelled SCs were plated on gels without beads and cultured under the same experimental conditions as previously described in §2.4. After 5 h in culture, cells were fixed with 2% paraformaldehyde in 0.1 M PBS (pH 7.4) for 30 min. After rinsing three times with PBS, samples were incubated with 0.1% Triton X-100 (VWR, Radnor, PA) in 0.1 M PBS for 5 min, rinsed two times with 0.1 M PBS and incubated with 1% bovine serum albumin (Sigma-Aldrich) in 0.1 M PBS for 30 min. Alexa 488-phalloidin methanolic stock stain solution was diluted 1:40 in PBS and added to samples for 1 h followed by two rinses with PBS. Cell nuclei were stained with TO-PRO-3 iodide (Sigma-Aldrich) diluted to 1 µg ml−1 in PBS. Samples were rinsed two times with PBS before they were imaged. To image the cells, two different lasers were used. A diode laser (640 nm) was used to image the nuclei of the cells in the far red spectrum, and an argon ion laser (488 nm) was used to image phalloidin-488.
3. Results and discussion
3.1. Schwann cells exhibited varying morphologies depending on substrate stiffness
When SCs were cultured on PA gels with elastic moduli of 0.24 ± 0.05 kPa, 1.70 ± 0.09 kPa, and 4.80 ± 0.29 kPa, three distinct types of morphologies were observed: unpolarized, bipolar and multipolar (figure 2a). The unpolarized morphology was characterized by a general circular shape with the cell nucleus located symmetrically in the centre of the cell. The bipolar morphology was characterized by two processes extending away from the nucleus. In general, the bipolar extensions were thin and elongated, sometimes displaying wide lamellar-like features at the tip of each extension. The multipolar morphology was characterized by the presence of three or more processes. Figure 2b shows the percentage occurrence of each morphology across elastic moduli to assess the influence of matrix stiffness on SC phenotype. These results suggest that the substrate's elastic modulus can be used to predetermine the morphology of SCs. This result takes particular significance considering studies showing that cellular morphology can influence growth and function [32]. Additionally, we found that the bipolar morphology was dominant across elastic moduli with increasing occurrence on stiffer substrates within this physiological range. Incorporating these stiffnesses in nerve regeneration strategies for targeting SCs to the injury site could be of great benefit, because recent studies have shown that the bipolar phenotype is characteristic of motile and migratory SCs [18].
Figure 2.
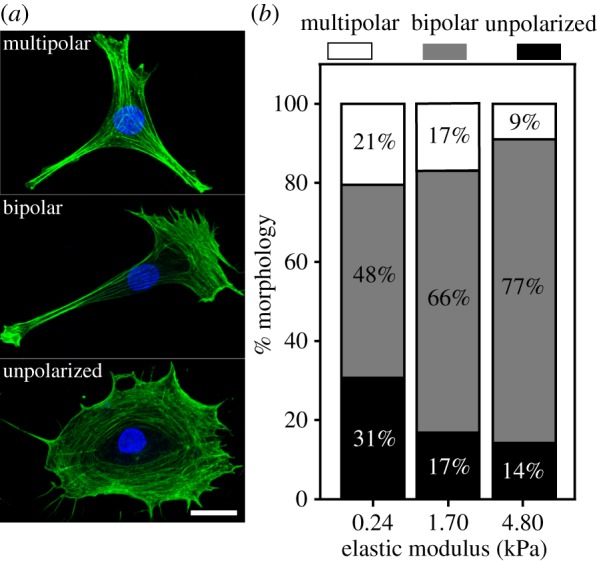
Substrate stiffness affected morphological distribution of SCs in vitro. (a) Maximum projection confocal micrographs of representative SCs exhibiting unpolarized, bipolar and multipolar morphologies (bottom to top) stained with phalloidin for actin, and TO-PRO-3 iodide for nuclei. Scale bar represents 20 µm. (b) Bar plot of the percentage occurrence of unpolarized (black), bipolar (grey) and multipolar (white) morphology occurrence per stiffness shows that the bipolar phenotype is most prevalent across all elastic moduli; 0.24 (n = 298), 1.70 (n = 382) and 4.80 kPa (n = 156). (Online version in colour.)
3.2. Schwann cells’ spreading area was unaffected by substrate stiffness
Focusing on bipolar SCs, the most common phenotype and the most relevant to in vivo function, we examined SC spreading. It is well known that the mechanical rigidity of the substrate alters the cellular shape and spreading area [33,34]. Furthermore, cell shape has been reported to affect cell fate [32,33,35], and cytoskeletal tension has been shown to be important for SC cycle progression [19]. Kidney epithelial cells [13], fibroblasts [13,35], vascular smooth muscle cells [36], aortic endothelial cells [35] and neutrophils [12] cultured on substrates of varying stiffness all showed reduced spreading area on the softest substrate. Unlike many other cells, SCs were able to adhere and extend protrusions, regardless of substrate stiffness. Additionally, figure 3 shows that SC spreading area was comparable across elastic moduli; median values of 1540 µm2 for E = 0.24 kPa, 1160 µm2 for E = 1.70 kPa and 1210 µm2 for E = 4.80 kPa, respectively. This suggests that SC spreading behaviour is relatively insensitive to the underlying mechanical substrate stiffness, contrary to almost all other mesenchymal or ameboid cell types.
Figure 3.
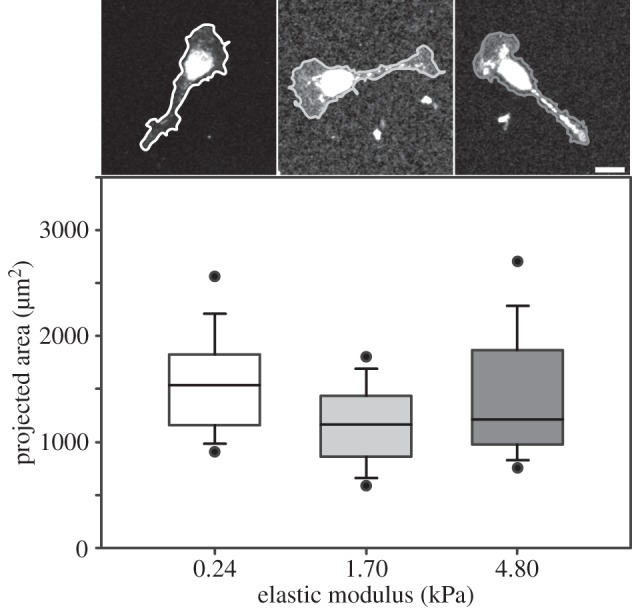
SC spreading area was similar across elastic moduli. Box and whiskers plot of SC spreading area for the three tested elastic moduli; 0.24 (n = 143), 1.70 (n = 252) and 4.80 kPa (n = 120). Solid bands: medians, top and bottom boxes: upper and lower quartiles, whiskers: standard deviations, and dots: fifth and 95th percentiles. Representative confocal micrographs of SCs for each elastic modulus are shown. Scale bar represents 20 µm.
3.3. Schwann cells exhibited stress fibres on soft materials
To investigate how SCs maintained a consistent spreading area across the different elastic moduli tested, we examined the structural organization of the SC cytoskeleton with the primary focus on filamentous actin. SCs were grown on the different elastic moduli as described before and their actin filaments were stained with phalloidin. As can be seen from figure 4, SCs exhibited a mature actin cytoskeleton with the presence of pronounced stress fibres across all moduli. In contrast to most other cells, SCs produced clearly visible stress fibres on gels of 0.24 kPa, which is indicative of a contractile phenotype with significant cell traction generation [37–39]. Intrigued by these findings, we quantified SC tractions across the different moduli to investigate what parameters supported the observed cytoskeletal arrangement and cell spreading areas presented in figures 3 and 4.
Figure 4.
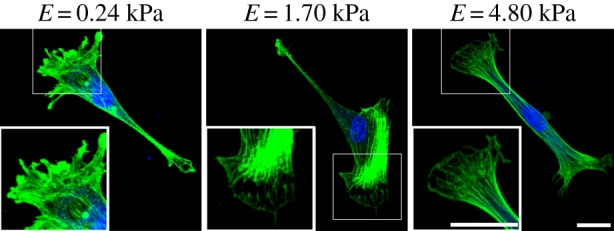
SCs exhibited a mature actin cytoskeleton, including stress fibres across all moduli. Maximum projection confocal micrographs of representative SCs cultured on elastic moduli of 0.24, 1.70 and 4.80 kPa that were stained with phalloidin for actin, and TO-PRO-3 iodide for nuclei. White box shows a two-times zoomed in image to highlight the stress fibres. Scale bars represents 20 µm. (Online version in colour.)
3.4. Schwann cells induced large three-dimensional tractions and material deformations
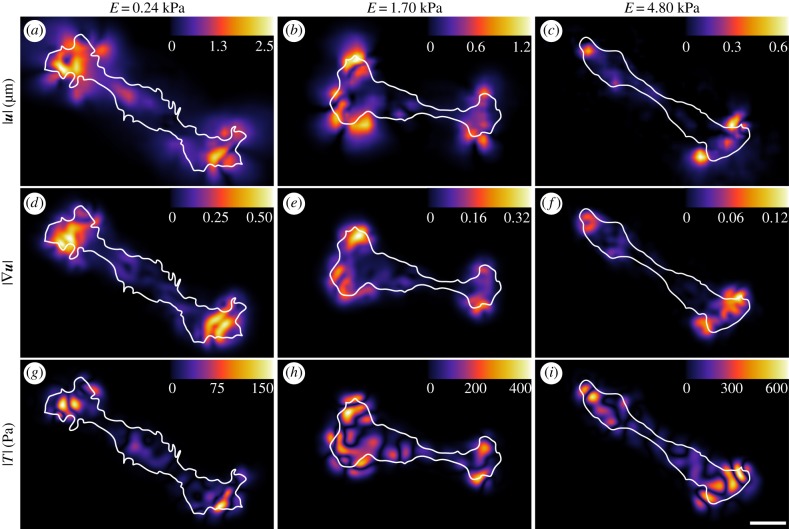
Motivated by our results, that both SC spread area and F-actin arrangement appeared to be unaffected by substrate stiffness, we quantified the material deformations caused by SCs across our substrate stiffnesses. Using our recently improved three-dimensional large deformation traction force microscopy technique [21], we quantified the three-dimensional SC displacement and traction field as a function of substrate stiffness. One of the key improvements in our technique is the incorporation of finite deformation constitutive models that allow proper determination of cell tractions in the presence of large deformations. This is a significant departure from most traditional TFM approaches that intrinsically assume infinitesimal material deformations. Figure 5 shows colour contour maps of the magnitudes of the three-dimensional displacement vector (a–c), the three-dimensional displacement gradient (d–f) and the three-dimensional surface tractions (g–i) across our three substrate moduli. To provide a robust comparison between cellular traction generation and cytoskeletal arrangement, we analysed both immunocytochemical images and SC tractions of a large population of cells and time points under identical experimental conditions. Consistent with the F-actin arrangement shown in figure 4, the spatial distribution of SC displacement and surface tractions was concentrated at both distal ends of the cells, indicating a highly polarized cell. The spatial distribution of displacement and traction profiles looked similar across the three substrate moduli, which is qualitatively consistent with the cytoskeletal arrangement shown in figure 4. While the distributions of SC displacements and tractions appeared minimally affected by the underlying substrate stiffness, the magnitude of the displacement values decreased as the substrate became stiffer, whereas the tractions increased. These results are consistent with general trends observed in other cell types; however SCs' displacement attenuation in our study is distinct and contrasts with other cells' across stiffnesses ranging from 1 to 10 kPa or greater [27]. Interestingly, when we performed additional TFM experiments of SC on PA gels of moduli greater than 5 kPa, we found no notable cell-generated material displacements during spreading and locomotion.
Figure 5.
SC displacements and tractions varied across substrate stiffness. Surface contour maps of the magnitude of (a–c) the three-dimensional displacement field  , (d–f) the displacement gradient
  and (g–i) the traction field (|T|) vector for each elastic modulus; 0.24, 1.70 and 4.80 kPa. The cell outline (white) is superimposed onto the contour maps to show its position with respect to each field. Scale bar represents 20 µm. (Online version in colour.)
Because SCs were capable of forming visible stress fibres on the soft PA gels, we investigated the material deformations that SCs might generate to maintain their stress fibres. Figure 5d–f shows the magnitude of the displacement gradient across stiffnesses. In linear elastic theory, the basis of most traditional TFM formulations that use the Boussinesq solution approach, the gradient term is deemed small, i.e.  . However, as shown in figure 5d, the deformation gradient on the 240 Pa gels was significant with peak levels above 0.5, indicating the existence of large deformations. Given the compliant nature of these gels, and the existence of stress fibres, it was not surprising that the cell would need to apply large enough deformations to maintain stable adhesion contacts conducive to the formation of stress fibres. Examining figures 5a,d,g and 4, we see that stress fibre formation was supported both by large material tractions and also through large material deformations. Given that the material deformations originate from intracellular force generation and regulation, we note that the magnitude of the displacement gradient decreased as the substrate stiffness increased, which supports the idea that less compliant substrates require less material deformation to achieve the necessary adhesion to produce stress fibres [37].
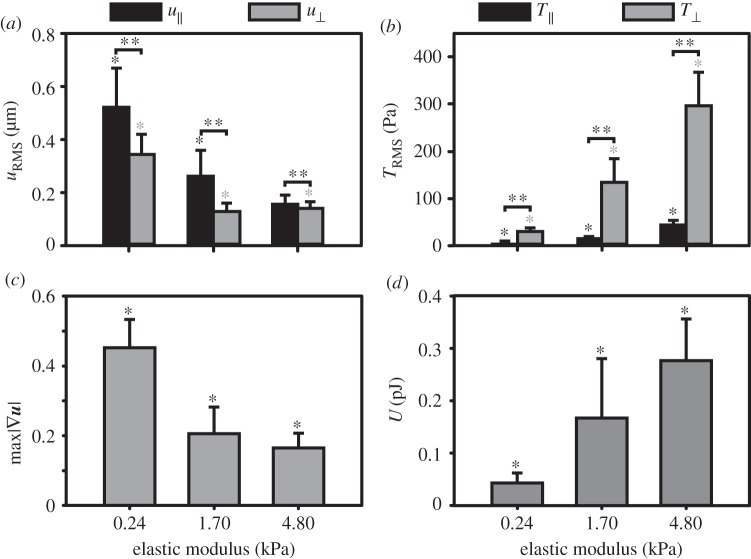
Figure 6a–c summarizes our displacement and traction results in a statistical bar plot format across all moduli to present a cumulative distribution of our findings for the bipolar morphology (see electronic supplementary material, figures S3 and S4, for more information about the unpolarized and multipolar phenotypes). We included calculations of the applied strain energy as an indication of the work carried out by the cells on the material (figure 6d). We believe this metric is useful as it is an integral measure of both the applied displacements and tractions. The strain energy of the SCs followed the same trend as the tractions across moduli showing that cells worked harder on the stiffer substrates to spread and locomote. Furthermore, as shown in figure 6a,b, we found significant differences between the in-plane (shear) and out-of-plane (normal) displacement and traction components, which are strongly attenuated by the underlying substrate stiffness. In particular, the normal traction component plays a significant role in the SC traction signature as the material stiffness increases.
Figure 6.
SC displacements, tractions and strain energies varied with elastic moduli. Bar plots of the (a) root-mean-squared displacements magnitude (uRMS), (b) root-mean-squared tractions (TRMS), (c) maximum displacement gradient magnitude  and (d) strain energy (U) as a function of elastic modulus; 0.24 (n = 143), 1.70 (n = 252) and 4.80 kPa (n = 120). The uRMS and TRMS values are split into their respective shear components
  and normal components
  (black and grey, respectively). Geometric mean (μg) and geometric mean absolute deviation (MAD) are shown. *p < 0.05 by one-way ANOVA on ranks across elastic moduli, and **p < 0.001 by t-test between normal and shear components, respectively.
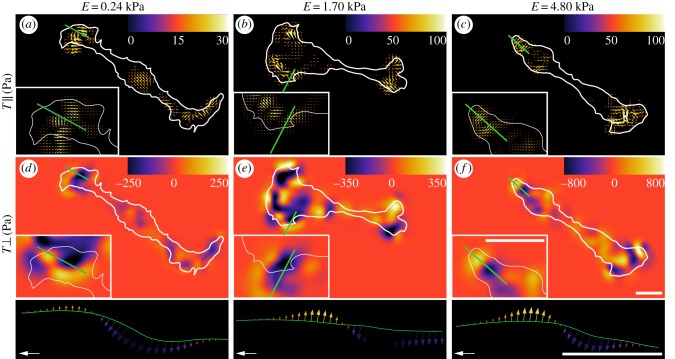
To investigate the observed shear and normal traction differences further, we plotted the shear and normal traction distribution of representative SCs across the three different moduli in figure 7. Consistent with the stiffness scaling observed in figure 6a–c, the shear tractions increase only slightly with increasing substrate stiffness, whereas the normal tractions show a significant increase in their magnitude (figure 7a–c). The spatial distribution of both the shear and normal tractions shows a highly polarized cell with most of the tractions applied at the distal ends.
Figure 7.
SC-induced normal tractions played a significant role in the SC traction profile and exhibited an alternating dipole pattern across substrate stiffness. (a–c) Vector field of the SC applied shear tractions  and (e–f) contour map of the SC applied normal tractions
  for the three tested substrate stiffnesses. The colour bar represents the magnitude of the respective component and the reference vector shows a shear traction magnitude of 250, 350 and 800 Pa for E = 0.24, E = 1.70, E = 4.80 kPa, respectively. The cell outline (white) is superimposed to show its position with respect to the tractions. Scale bar represents 20 μm. (Online version in colour.)
3.5. Schwann cells generated significant normal tractions and out-of-plane moments
Perhaps even more interesting is the alternating dipole pattern in the normal SC traction profile prevalent across all stiffnesses (figure 7). These normal traction dipole patterns give rise to local rotational moments, which can be seen clearly in the bottom row of figure 7. Here, the local variation in the cell traction vector is plotted along the arbitrarily drawn line in figure 7a–f. Motivated by recent findings, Legant et al. [20] showing that embryonic mesenchymal fibroblasts are capable of generating local rotational out-of-plane moments stemming from an intracellular force transmission of actomyosin onto an adhesion patch of discrete size, we investigated whether our observed traction patterns shared a similar structural origin. Analogous to Legant et al., we constructed a simple finite-element model (FEM) of a discrete cellular adhesion patch with similar dimensions, diameter ≈ 6 µm, height = 150 nm. Figure 8a shows a schematic representation of how an SC might apply force onto the discrete adhesion patch. We assumed firm bonding of the adhesion patch to the underlying substrate and applied uniform shear traction across the adhesion patch simulating the intracellular actomyosin contractile force. The shear traction magnitude loading was determined by matching the maximum displacement magnitudes of the simulated to the experimentally observed ones. This procedure allows us to obtain an order of magnitude estimate of the intracellular force generation that is transmitted via the SC stress fibres. All simulations were performed using 39123 four-node, linear, tetrahedron continuum elements (C3D4) in Abaqus/Standard v. 6.12-2 (Dassault Systèmes Simulia, Providence, RI).
Figure 8.
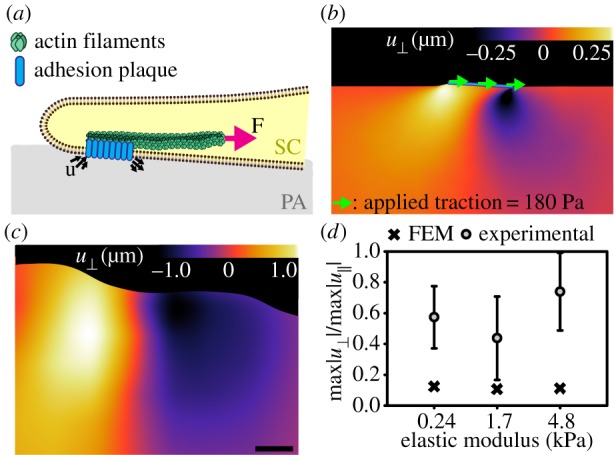
Finite-element simulation approximates the experimentally observed dipole and out-of-plane SC displacement behaviour. (a) Schematic cartoon showing how SC might transmit force at an adhesion plaque of discrete size. Intracellular actin filaments contract with a force F, inducing dipole such as displacements (u) and rotational moments about the adhesion plaque. (b) Contour map of the FEM results along the symmetry plane showing the normal displacements  induced in the deformed configuration of the PA gel (E = 0.24 kPa). The adhesion plaque is modelled as a rigid plate that is firmly bonded to the PA gel with a uniform shear traction of magnitude 180 Pa applied to the top surface of the FA plaque. (c) Experimentally measured out-of-plane SC displacement field. Scale bar represents 5 μm. (d) Plot of the mean normal and shear maximum displacement ratios from our experimental measurements and our finite-element analysis across elastic moduli. (Online version in colour.)
Based on the geometry of our simulations, the applied shear tractions we determined are 180, 700 and 1000 Pa for each increasing stiffness, which fall within the range of previously reported stress values sustained at cellular adhesion sites [40–43]. Our finite-element simulation shows that it qualitatively reproduces the experimentally observed dipole behaviour in the measured out-of-plane displacements (figure 8b,c and see the electronic supplementary material, figure S5 for the FEM results for each displacement component). Figure 8d depicts the average normal and shear maximum displacement ratios from our experimental measurements and our finite-element analysis across the three different elastic moduli. As can be seen in figure 8d, the qualitative behaviour of the displacement ratios across the different stiffnesses is similar in the simulations when compared with our experimental measurements, and on the same order of magnitude, suggesting that our model is capable of qualitatively describing the appropriate cellular deformation behaviour. The quantitative differences between the experimental and modelling ratios are not surprising given the simple nature of our model and the large possible parameter space within a real adhesion plaque. Furthermore, these qualitative observations are consistent with the cellular deformation signature previously reported for embryonic mesenchymal fibroblasts [20].
4. Conclusion
In this study, we have presented a detailed biophysical characterization of SCs across a range of elastic moduli typically encountered in the PNS. Given the importance of SCs during nerve development, axon maintenance and neuronal regeneration following an injury [2], our results provide significant insights into the mechanosensitivity of these cells. In particular, we find that SCs have a strong preference to acquire the prevalent in vivo bipolar morphology even in the absence of environmental cues. This preference seems to be further stabilized by increasing substrate stiffness. We found that approximately 48% of all SCs exhibited a bipolar phenotype on our soft (0.24 kPa) substrates, a number that increases to 77% on 4.80 kPa, our stiffest substrate examined. Of note and contrary to most anchorage-dependent cells, we observed that SC spread area was unaffected by the modulus of the underlying substrate and that cells on all stiffnesses showed pronounced stress fibres as part of their actin cytoskeleton. This was true even for SCs attached and locomoting on 0.24 kPa PA gels. Motivated by previous results showing that the existence of actin stress fibres requires substantial force transmission onto the cell substrate, we quantified the three-dimensional SC deformation fields. We found that on our softest (0.24 kPa) PA gels, SCs generate large deformations, albeit small tractions, that required careful analysis within a finite deformation, rather than a traditional linear elastic framework. We believe that these large deformations are necessary to stabilize the formation of actin stress fibres on such highly compliant surfaces. Consistent with previous observations, SC tractions increased with increasing substrate stiffness; however, cell-generated displacement magnitudes decreased to the point of negligible cell displacements during locomotion on substrates with stiffnesses greater than 5 kPa. When comparing SC in-plane to out-of-plane tractions, we find that SCs exert significant out-of-plane tractions on all moduli investigated. Furthermore, we show that these out-of-plane tractions give rise to local rotational moments, which we qualitatively attribute to the deformation signature of actomyosin force transmission at discrete adhesion plaques similar to that shown by Legant et al. for mesenchymal embryonic fibroblasts. Taken together, these findings provide the first set of quantitative biophysical measurements on the mechanosensitivity of SCs across a range of tissue stiffnesses typically encountered in the PNS in vivo. We believe these results will provide critical information for the development of improved nerve guidance channels and regenerative scaffolds by considering the mechanosensitive characteristics of SCs.
Supplementary Material
Acknowledgements
The authors thank Jennet Toyjanova for her helpful discussions, and Yu-Ting Liu Dingle for her assistance in preparing figure 1.
Funding statement
This work is supported by NIH IMSD R25GM083270-01 and NSF Graduate Research Fellowship to C.L.F; NSF CBET 1134166 to D.H.K; NSF Graduate Research Fellowship to E.B.K.
References
- 1.Horner PJ, Gage FH. 2000. Regenerating the damaged central nervous system. Nature 407, 963–970. ( 10.1038/35039559) [DOI] [PubMed] [Google Scholar]
- 2.Jessen KR, Mirsky R. 1999. Schwann cells and their precursors emerge as major regulators of nerve development. Trends Neurosci. 22, 402–410. ( 10.1016/S0166-2236(98)01391-5) [DOI] [PubMed] [Google Scholar]
- 3.Jessen KR, Mirsky R. 2005. The origin and development of glial cells in peripheral nerves. Nat. Rev. Neurosci. 6, 671–682. ( 10.1038/nrn1746) [DOI] [PubMed] [Google Scholar]
- 4.Bhatheja K, Field J. 2006. Schwann cells: origins and role in axonal maintenance and regeneration. Int. J. Biochem. Cell Biol. 38, 1995–1999. ( 10.1016/j.biocel.2006.05.007) [DOI] [PubMed] [Google Scholar]
- 5.Höke A. 2006. Mechanisms of disease: what factors limit the success of peripheral nerve regeneration in humans? Nat. Clin. Pract. Neurol. 2, 448–454. ( 10.1038/ncpneuro0262) [DOI] [PubMed] [Google Scholar]
- 6.Rodrigues MCO, Rodrigues AA, Glover LE, Voltarelli J, Borlongan CV. 2012. Peripheral nerve repair with cultured Schwann cells: getting closer to the clinics. Sci. World J. 2012, 413091 ( 10.1100/2012/413091) [DOI] [PMC free article] [PubMed] [Google Scholar]
- 7.Kromer LF, Cornbrooks CJ. 1985. Transplants of Schwann cell cultures promote axonal regeneration in the adult mammalian brain. Proc. Natl Acad. Sci. USA 82, 6330–6334. ( 10.1073/pnas.82.18.6330) [DOI] [PMC free article] [PubMed] [Google Scholar]
- 8.Bunge MB. 1994. Transplantation of purified populations of Schwann cells into lesioned adult rat spinal cord. J. Neurol. 242, S36–S39. ( 10.1007/BF00939240) [DOI] [PubMed] [Google Scholar]
- 9.Xu XM, Guénard V, Kleitman N, Bunge MB. 1995. Axonal regeneration into Schwann cell-seeded guidance channels grafted into transected adult rat spinal cord. J. Comp. Neurol. 351, 145–160. ( 10.1002/cne.903510113) [DOI] [PubMed] [Google Scholar]
- 10.Engler AJ, Griffin MA, Sen S, Bönnemann CG, Sweeney HL, Discher DE. 2004. Myotubes differentiate optimally on substrates with tissue-like stiffness pathological implications for soft or stiff microenvironments. J. Cell Biol. 166, 877–887. ( 10.1083/jcb.200405004) [DOI] [PMC free article] [PubMed] [Google Scholar]
- 11.Engler AJ, Sen S, Sweeney HL, Discher DE. 2006. Matrix elasticity directs stem cell lineage specification. Cell 126, 677–689. ( 10.1016/j.cell.2006.06.044) [DOI] [PubMed] [Google Scholar]
- 12.Oakes PW, Patel DC, Morin NA, Zitterbart DP, Fabry B, Reichner JS, Tang JX. 2009. Neutrophil morphology and migration are affected by substrate elasticity. Blood 114, 1387–1395. ( 10.1182/blood-2008-11-191445) [DOI] [PMC free article] [PubMed] [Google Scholar]
- 13.Pelham RJ, Wang Y-L. 1997. Cell locomotion and focal adhesions are regulated by substrate flexibility. Proc. Natl Acad. Sci. USA 94, 13 661–13 665. ( 10.1073/pnas.94.25.13661) [DOI] [PMC free article] [PubMed] [Google Scholar]
- 14.Wang H-B, Dembo M, Wang Y-L. 2000. Substrate flexibility regulates growth and apoptosis of normal but not transformed cells. Am. J. Physiol. Cell Physiol. 279, C1345–C1350. [DOI] [PubMed] [Google Scholar]
- 15.Gu Y, Ji Y, Zhao Y, Liu Y, Ding F, Gu X, Yang Y. 2012. The influence of substrate stiffness on the behavior and functions of Schwann cells in culture. Biomaterials 33, 6672–6681. ( 10.1016/j.biomaterials.2012.06.006) [DOI] [PubMed] [Google Scholar]
- 16.Hirakawa K, Hashizume K, Hayashi T. 1981. Viscoelastic property of human brain for the analysis of impact injury (author's transl). No To Shinkei 33, 1057–1065. [PubMed] [Google Scholar]
- 17.Miller K, Chinzei K, Orssengo G, Bednarz P. 2000. Mechanical properties of brain tissue in vivo: experiment and computer simulation. J. Biomech. 33, 1369–1376. ( 10.1016/S0021-9290(00)00120-2) [DOI] [PubMed] [Google Scholar]
- 18.Mitchel JA, Hoffman-Kim D. 2011. Cellular scale anisotropic topography guides Schwann cell motility. PLoS ONE 6, e24316 ( 10.1371/journal.pone.0024316) [DOI] [PMC free article] [PubMed] [Google Scholar]
- 19.Wang Y, Teng H-L, Huang Z-H. 2012. Intrinsic migratory properties of cultured Schwann cells based on single-cell migration assay. PLoS ONE 7, e51824 ( 10.1371/journal.pone.0051824) [DOI] [PMC free article] [PubMed] [Google Scholar]
- 20.Legant WR, Choi CK, Miller JS, Shao L, Gao L, Betzig E, Chen CS. 2013. Multidimensional traction force microscopy reveals out-of-plane rotational moments about focal adhesions. Proc. Natl Acad. Sci. USA 110, 881–886. ( 10.1073/pnas.1207997110) [DOI] [PMC free article] [PubMed] [Google Scholar]
- 21.Toyjanova J, Bar-Kochba E, Lopez-Fagundo C, Reichner JS, Hoffman-Kim D, Franck C. 2014. High resolution, large deformation 3D traction force microscopy. PLoS ONE 9, e90976 ( 10.1371/journal.pone.0090976) [DOI] [PMC free article] [PubMed] [Google Scholar]
- 22.Bar-Kochba E, Toyjanova J, Andrews E, Kim K-S, Franck C. In press. A fast iterative digital volume correlation algorithm for large deformations. Exp. Mech. ( 10.1007/s11340-014-9874-2) [DOI] [Google Scholar]
- 23.Farid H, Simoncelli EP. 2004. Differentiation of discrete multidimensional signals. IEEE Trans. Image Process. 13, 496–508. ( 10.1109/TIP.2004.823819) [DOI] [PubMed] [Google Scholar]
- 24.Butler JP, Tolić-Nørrelykke IM, Fabry B, Fredberg JJ. 2002. Traction fields, moments, and strain energy that cells exert on their surroundings. Am. J. Physiol. Cell Physiol. 282, C595–C605. ( 10.1152/ajpcell.00270.2001) [DOI] [PubMed] [Google Scholar]
- 25.Hur SS, Zhao Y, Li Y-S, Botvinick E, Chien S. 2009. Live cells exert 3-dimensional traction forces on their substrata. Cell. Mol. Bioeng. 2, 425–436. ( 10.1007/s12195-009-0082-6) [DOI] [PMC free article] [PubMed] [Google Scholar]
- 26.Koch TM, Münster S, Bonakdar N, Butler JP, Fabry B. 2012. 3D traction forces in cancer cell invasion. PLoS ONE 7, e33476 ( 10.1371/journal.pone.0033476) [DOI] [PMC free article] [PubMed] [Google Scholar]
- 27.Maskarinec SA, Franck C, Tirrell DA, Ravichandran G. 2009. Quantifying cellular traction forces in three dimensions. Proc. Natl Acad. Sci. USA 106, 22 108–22 113. ( 10.1073/pnas.0904565106) [DOI] [PMC free article] [PubMed] [Google Scholar]
- 28.Yang Z, Lin J-S, Chen J, Wang JH. 2006. Determining substrate displacement and cell traction fields—a new approach. J. Theor. Biol. 242, 607–616. ( 10.1016/j.jtbi.2006.05.005) [DOI] [PubMed] [Google Scholar]
- 29.Bower AF. 2011. Applied mechanics of solids. Boca Raton, FL: CRC Press. [Google Scholar]
- 30.D'Errico J. 2005. Surface fitting using gridfit. MATLAB central file exchange. See http://www.mathworks.com/matlabcentral/fileexchange/8998-surface-fitting-using-gridfit. [Google Scholar]
- 31.Dembo M, Wang Y-L. 1999. Stresses at the cell-to-substrate interface during locomotion of fibroblasts. Biophys. J. 76, 2307–2316. ( 10.1016/S0006-3495(99)77386-8) [DOI] [PMC free article] [PubMed] [Google Scholar]
- 32.Chen CS, Mrksich M, Huang S, Whitesides GM, Ingber DE. 1997. Geometric control of cell life and death. Science 276, 1425–1428. ( 10.1126/science.276.5317.1425) [DOI] [PubMed] [Google Scholar]
- 33.Discher DE, Janmey P, Wang Y-L. 2005. Tissue cells feel and respond to the stiffness of their substrate. Science 310, 1139–1143. ( 10.1126/science.1116995) [DOI] [PubMed] [Google Scholar]
- 34.Solon J, Levental I, Sengupta K, Georges PC, Janmey PA. 2007. Fibroblast adaptation and stiffness matching to soft elastic substrates. Biophys. J. 93, 4453–4461. ( 10.1529/biophysj.106.101386) [DOI] [PMC free article] [PubMed] [Google Scholar]
- 35.Yeung T, et al. 2005. Effects of substrate stiffness on cell morphology, cytoskeletal structure, and adhesion. Cell Motil. Cytoskelet. 60, 24–34. ( 10.1002/cm.20041) [DOI] [PubMed] [Google Scholar]
- 36.Brown XQ, Ookawa K, Wong JY. 2005. Evaluation of polydimethylsiloxane scaffolds with physiologically-relevant elastic moduli: interplay of substrate mechanics and surface chemistry effects on vascular smooth muscle cell response. Biomaterials 26, 3123–3129. ( 10.1016/j.biomaterials.2004.08.009) [DOI] [PubMed] [Google Scholar]
- 37.Gardel ML, Sabass B, Ji L, Danuser G, Schwarz US, Waterman CM. 2008. Traction stress in focal adhesions correlates biphasically with actin retrograde flow speed. J. Cell. 183, 999–1005. ( 10.1083/jcb.200810060) [DOI] [PMC free article] [PubMed] [Google Scholar]
- 38.Schwarz U, Balaban N, Riveline D, Addadi L, Bershadsky A, Safran S, Geiger B. 2003. Measurement of cellular forces at focal adhesions using elastic micro-patterned substrates. Mater. Sci. Eng. C 23, 387–394. ( 10.1016/S0928-4931(02)00309-0) [DOI] [Google Scholar]
- 39.Schwarz US, Gardel ML. 2012. United we stand—integrating the actin cytoskeleton and cell–matrix adhesions in cellular mechanotransduction. J. Cell Sci. 125, 3051–3060. ( 10.1242/jcs.093716) [DOI] [PMC free article] [PubMed] [Google Scholar]
- 40.Aratyn-Schaus Y, Gardel ML. 2008. Biophysics: clutch dynamics. Science 322, 1646–1647. ( 10.1126/science.1168102) [DOI] [PubMed] [Google Scholar]
- 41.Aratyn-Schaus Y, Gardel ML. 2010. Transient frictional slip between integrin and the ECM in focal adhesions under myosin II tension. Curr. Biol. 20, 1145–1153. ( 10.1016/j.cub.2010.05.049) [DOI] [PMC free article] [PubMed] [Google Scholar]
- 42.Aratyn-Schaus Y, Oakes PW, Gardel ML. 2011. Dynamic and structural signatures of lamellar actomyosin force generation. Mol. Biol. Cell. 22, 1330–1339. ( 10.1091/mbc.E10-11-0891) [DOI] [PMC free article] [PubMed] [Google Scholar]
- 43.Tan JL, Tien J, Pirone DM, Gray DS, Bhadriraju K, Chen CS. 2003. Cells lying on a bed of microneedles: an approach to isolate mechanical force. Proc. Natl Acad. Sci. USA 100, 1484–1489. ( 10.1073/pnas.0235407100) [DOI] [PMC free article] [PubMed] [Google Scholar]
Associated Data
This section collects any data citations, data availability statements, or supplementary materials included in this article.


